Rebuilding the World Bank's open data site
Wiredcraft rebuilt the World Bank's open data site to be mobile-friendly and data-light.
Context
In May 2015, we commenced work on our biggest data-focused project to date. The World Bank’s data team hired us to rebuild their open data site, which is a repository and visualization engine for all of the Bank’s data, covering the world’s economies, finance, development, and much, much more.
The World Bank Group is an international financial institution that provides loans to developing countries for capital programs.
Challenges & Goals
Goals:
- Build a user-friendly data visualization website for public consumption
- Optimize a vast trove of data to be accessed easily, quickly, and on mobile
Challenges:
- Huge reams of data: the Bank continually collects an incredible amount of data and it all needs to be accessible on-demand
- Accessibility: this is an open data site, so the goal is to provide access to everyone
- Mobile: an increasing number of people are coming online for the first time using a mobile device
- Low bandwidth: an enormous amount of potential users live in areas without access to high-speed internet
- Multilingual: five core languages for the whole site and provide as many country pages as feasible in the native language
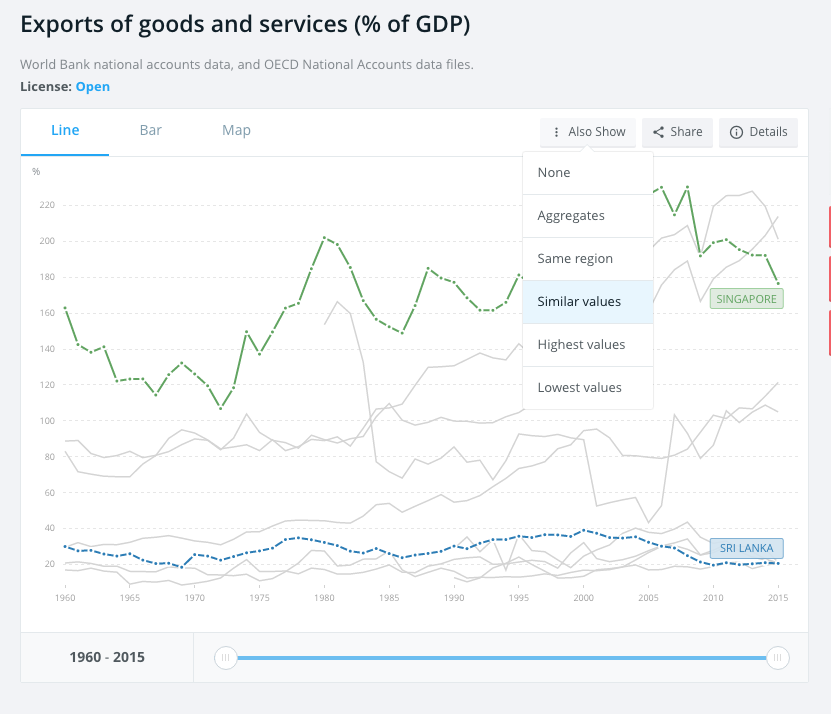
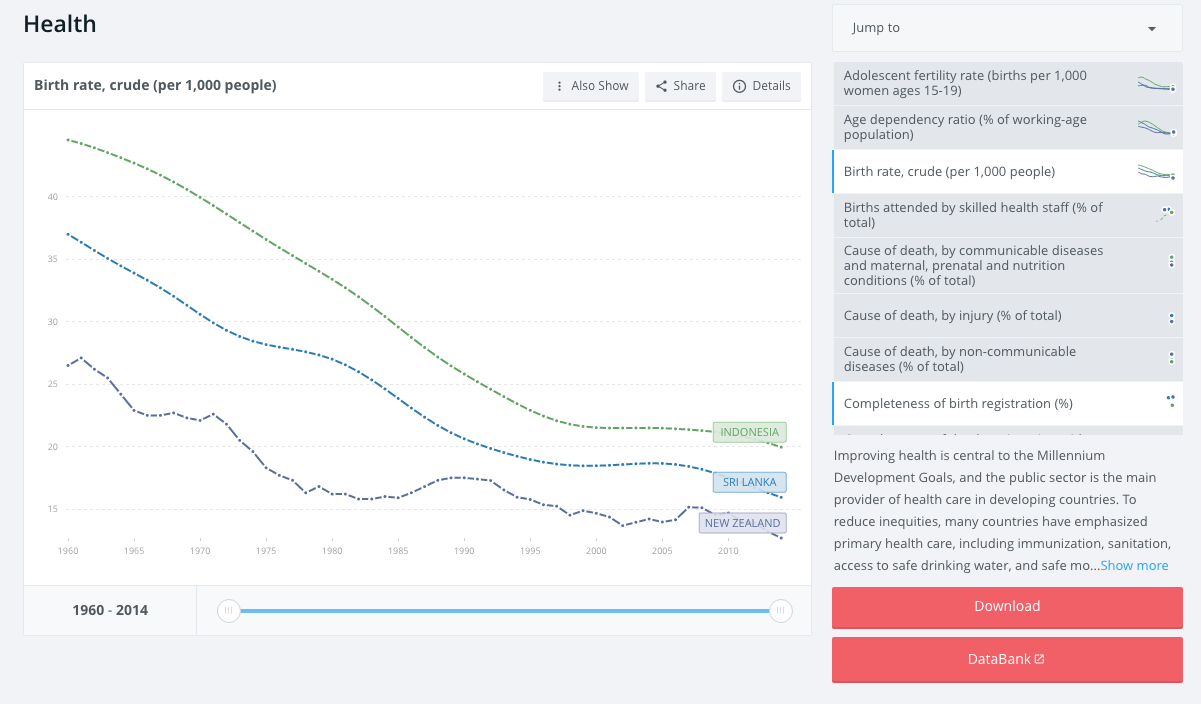
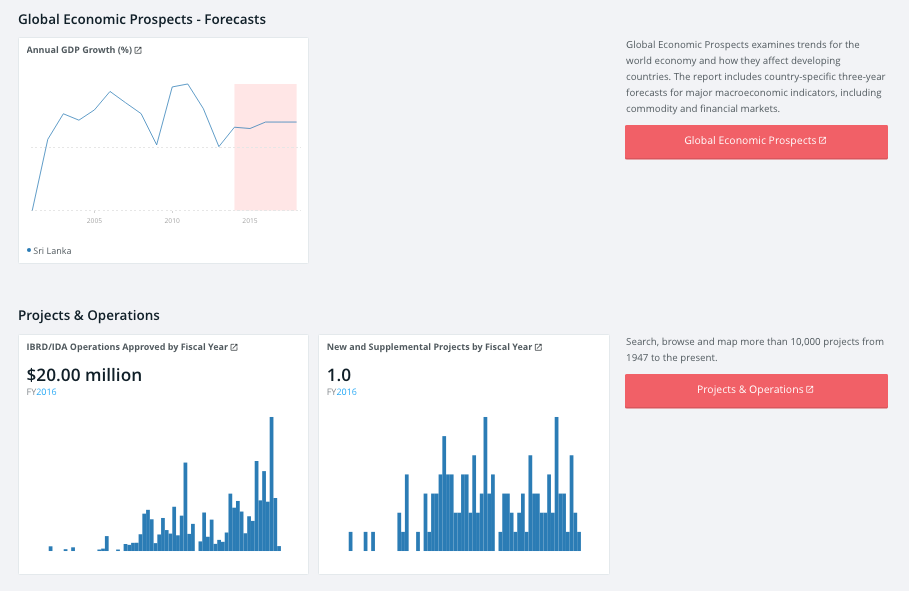
- Dynamic visualization: the charts and graphs aren’t universal, so we needed to find solutions to accurately present all of the data
Design Process
Due to the scale and importance of this project, the Wiredcraft team took its time thinking through designing the product. After hosting workshops with the World Bank’s team, we established a need for feature parity with the previous version of the website and key integration points with some of the World Bank’s other services (databank.worldbank.org & datacatalog.worldbank.org).
The key user personas for designing this product were:
- Academics
- Journalists
- International development staff
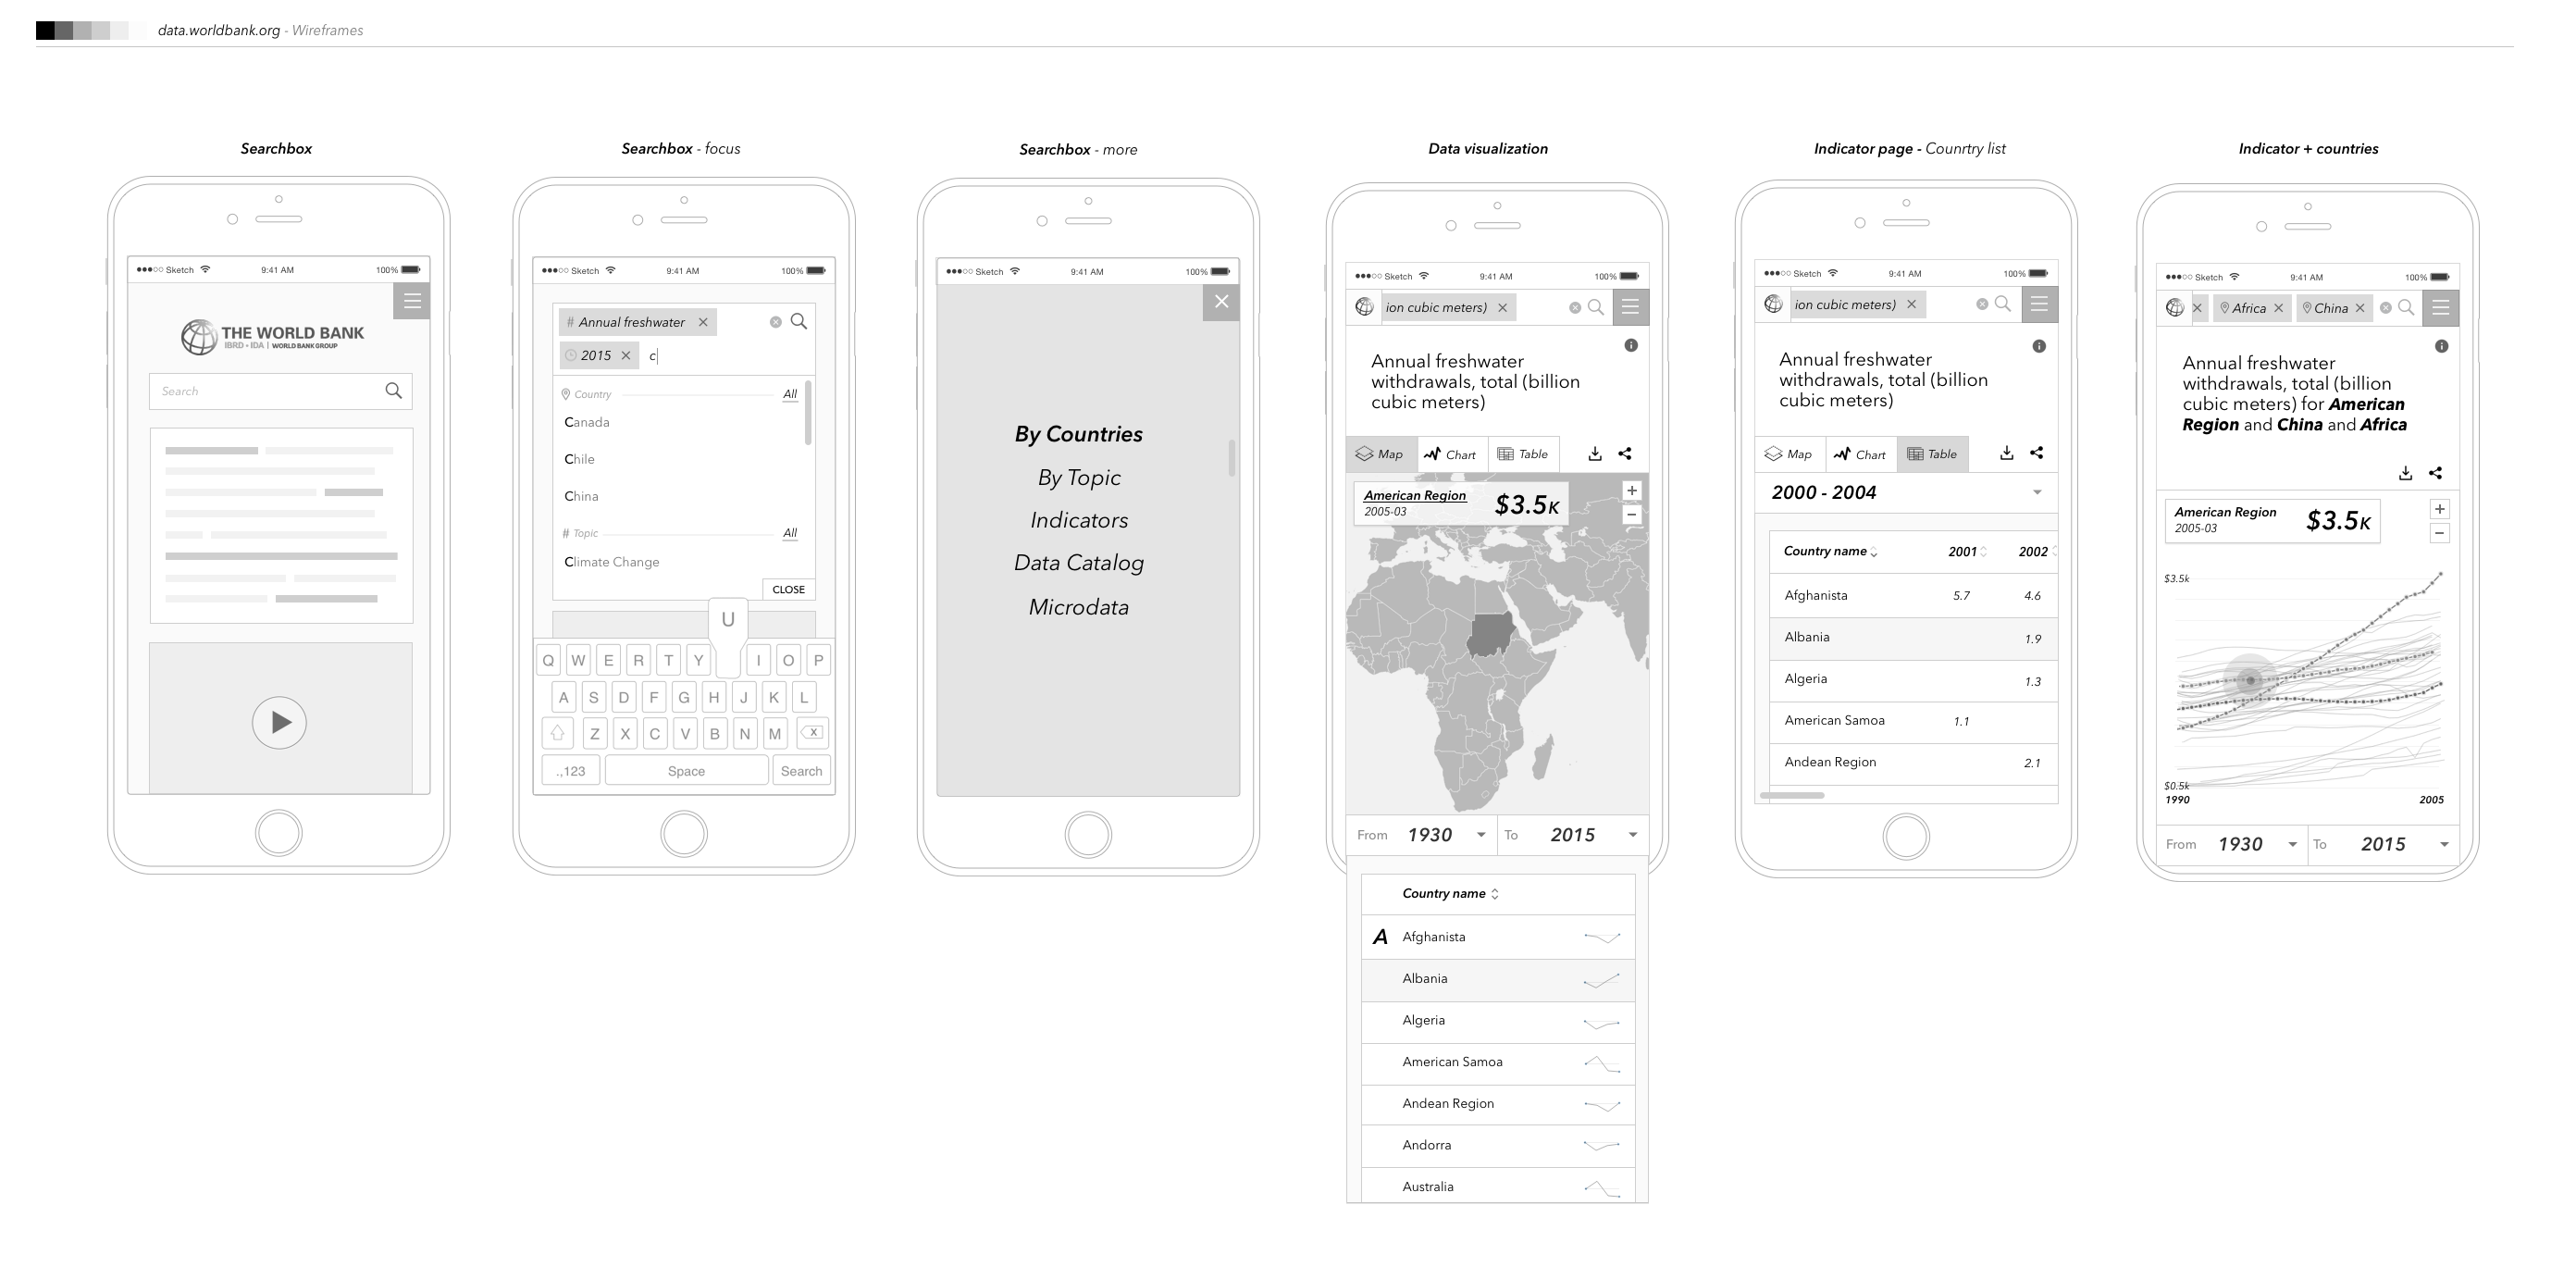
This is one of our initial wireframes, highlighting our core approach of building the site as a single-page, search-based app.
Metrics
- 9 months
- 3,283 Github commits
- 761 Github issues
- 3-months of public beta
- 1400 development indicators
Technology & Techniques
- Falcor: we used this new technology from Netflix to reduce data requests and speed up the dataflow
- Node.js: the backend is based on this technology
- Webpack: splitting the code with Webpack really cut down data requests (>50%) and decreased the initial load time for the app
- React: the frontend is based on this technology
- D3.js: we used this to create the visualizations
Takeaways
- We learned how work with a client quite literally on the other side of the world. World Bank HQ is in DC, which is 12 hours behind our Shanghai team.
- We’re old hands with data viz, but we learned a ton about accessibility and reducing load times and data requests
- Integrating new tech and practices isn’t easy, especially on the fly, but we identified good processes for testing new things and implementing them smoothly.