Dashed Line Segmentation in D3.js

As everybody knows by now, D3 is a pretty nifty tool for creating interactive data visualizations: its simple yet powerful data binding API affords extraordinary flexibility for creating almost every kind of chart imaginable. The downside with this flexibility is, however, that solving some common visualization problems might take a bit more work than with your average high-level charting library.
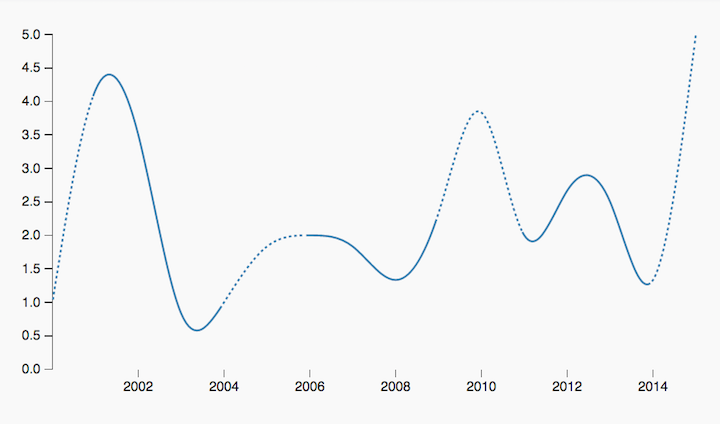
One of these problems is implementing dashed lines in a line chart - a common way to indicate uncertainty in your data. D3, at least at the time of writing, does not provide an out-of-the-box feature for dashing lines. Fear not though, since in this article we’ll walk through a simple solution to dash your lines for days on end. For more details, check out the code at JSFiddle.
The Algorithm
In brief, we’ll figure out the dashed segments, calculate their lengths along the path element, and use these lengths to derive the stroke-dash-array property.
The first thing we need is a list of the dashed segments, namely their starting and ending indices. Utilizing lodash.reduce gives us a neat & functional implementation:
function getDashedRanges(data) {
  const hasOpenRange = (arr) => _.last(arr) && !('end' in _.last(arr))
  const lastIndex = data.length - 1

  return _.reduce(data, (res, d, i) => {
    const isRangeStart = !hasOpenRange(res) && isDashed(d)
    if (isRangeStart) res.push({ start: Math.max(0, i - 1) })

    const isRangeEnd = hasOpenRange(res) && (!isDashed(d) || i === lastIndex)
    if (isRangeEnd) res[res.length - 1].end = i

    return res
  }, [])
}
isDashed simply checks the certainty property, which I’ve added to each data item (faintly mimicking the Google Charts API):
function isDashed(d) {
  return !d.certainty
}
You’re free to come up with your own method of indicating uncertainty: return d.value !== 4 if you don’t trust the number 4, for example.
Next, we’ll need a list of path lengths at each data point. We’re using the getTotalLength and getPointAtLength methods from the SVG specs to define a new function, getPathLengthAtX. getPathLengthAtX basically approximates the length of a path element at given x coordinate:
function getPathLengthAtX(path, x) {
  const EPSILON = 1
  let point
  let target
  let start = 0
  let end = path.getTotalLength()

  // Mad binary search, yo
  while (true) {
    target = Math.floor((start + end) / 2)
    point = path.getPointAtLength(target)

    if (Math.abs(point.x - x) <= EPSILON) break

    if ((target >= end || target <= start) && point.x !== x) {
      break
    }

    if (point.x > x) {
      end = target
    } else if (point.x < x) {
      start = target
    } else {
      break
    }
  }

  return target
}
Then we’ll just put our state-of-the-art method to work, mapping it over the data:
const lengths = data.map(d => getPathLengthAtX(path, scales.x(d.date)))
Easy!
Finally, we’ll take the dashed segments and path lengths, and use them to build the stroke-dash-array property:
function buildDashArray(dashedRanges, lengths) {
  return _.reduce(dashedRanges, (res, { start, end }, i) => {
    const prevEnd = i === 0 ? 0 : dashedRanges[i - 1].end

    const normalSegment = lengths[start] - lengths[prevEnd]
    const dashedSegment = getDashedSegment(lengths[end] - lengths[start])

    return res.concat([normalSegment, dashedSegment])
  }, [])
}
For each non-dashed segment, append the length of the segment; for dashed segments, append dash & blank lengths totaling up to the segment length:
function getDashedSegment(length) {
  const totalDashLen = DASH_LENGTH + DASH_SEPARATOR_LENGTH
  const dashCount = Math.floor(length / totalDashLen)
  return _.range(dashCount)
    .map(() => DASH_SEPARATOR_LENGTH + ',' + DASH_LENGTH)
    .concat(length - dashCount * totalDashLen)
    .join(',')
}
And there you go, dashed line segments! It took a bit of work, but we got there in the end. At this point one might ask, why not just build your path out of multiple line elements, i.e. adding separate elements for the dashed regions? That’s because the aforementioned method breaks interpolation. A more sophisticated hacker might use clip-paths to solve the dilemma; both solutions, however, force you to split your line into multiple elements which is, in most cases, undesirable (clip-paths are the way to go if you need something more advanced than dashed or blank segments, though).
Check out the code at JSFiddle.
Stay tuned
Follow our newsletter or our WeChat account; every other week you'll receive news about what we're up to, our events and our insights on digital products, omnichannel, cross-border ecommerce or whatever the team fancies.
-
Add us on WeChat

-
Subscribe to our newsletter