
Last Thursday, the World Bank’s data team announced the forthcoming all-new data.worldbank.org website. The new site will be part of the World Bank’s long-term commitment towards opening their data to the world. There are many improvements over the previous site, including more interactive data visualizations for charts and maps, a user-friendly search bar to traverse multiple datasets, and adding support for mobile browsing using responsive design. Wiredcraft is proud to work in collaboration with the World Bank’s data team in developing this new site.
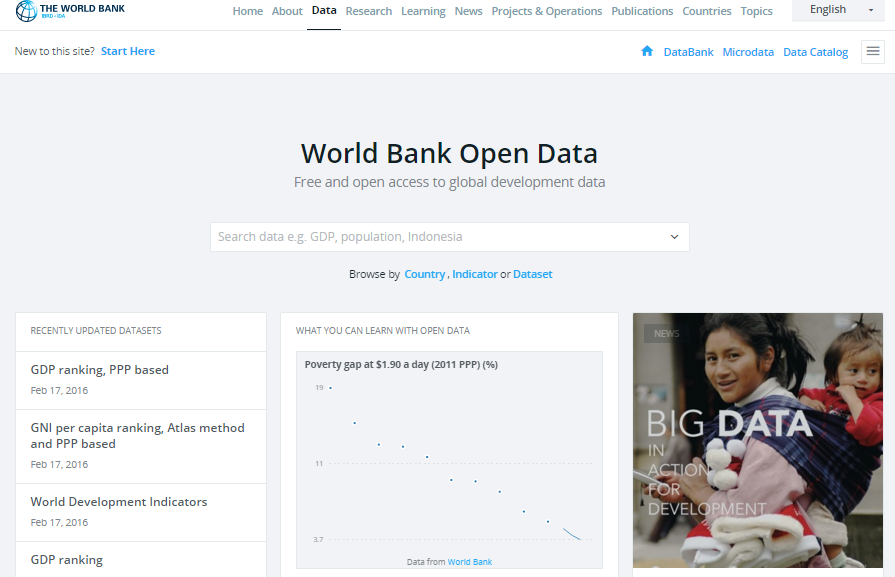
The site runs on a Node.js backend and we’ve diverged from the age-old technique of having separate page loads for every site action, rebuilding the site with a modern single-page app approach. This means we only load data to change the graphs and components that need updating. When a user searches for and selects an indicator, country, or topic, we don’t need to request an entirely new page; we’re generating a chart in the same page with new data loading in place. Even though the site is essentially a single page app, for the sake of maximizing SEO, we change the URL on the fly for each new chart update or site action.
To maintain a good SEO ranking and increase the initial page-load speed, we do server-side rendering (for some JS-driven sites, the site is crawled before the JS has rendered the DOM; server-side rendering remediates this problem). The data flows in from the World Bank’s Open Data API and we wrap that API with FalcorJS and use a Redis cache to enhance the site’s performance.
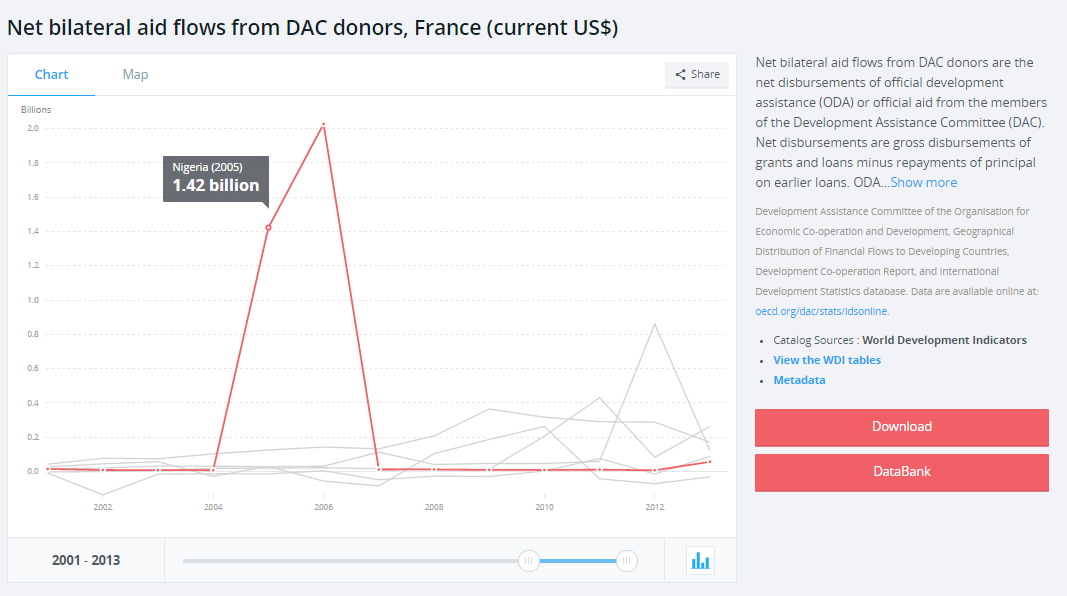
In the backend, we use FalcorJS to traverse the data, which is a service for making data fetching and transfer more declarative rather than imperative. The Falcor server is well-suited for interpreting complex requests and returning relevant data. We thought long and hard about trying this new technology for such a big project, but it turns out we love Falcor because it saves time and headaches for developers and users alike. Falcor batches multiple sequential requests into one in order to reduce the request count, which has resulted in noticeable mobile performance improvements.
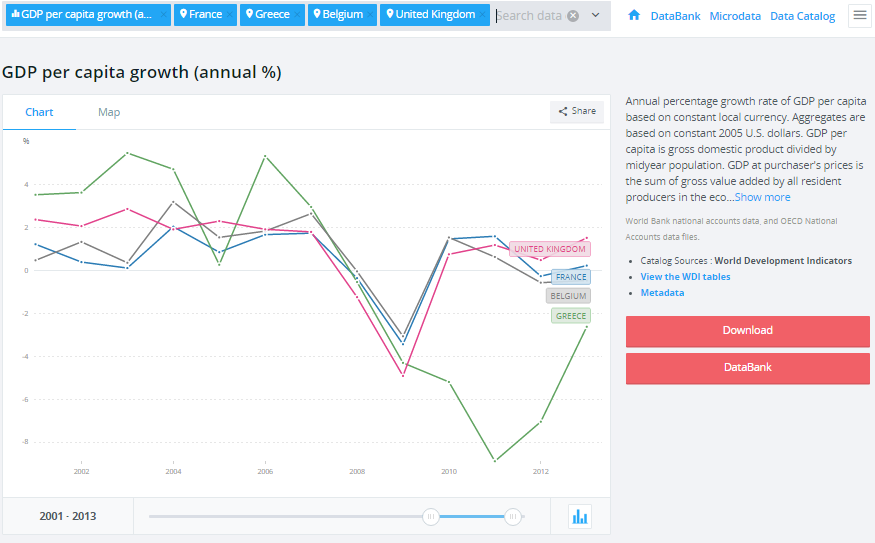
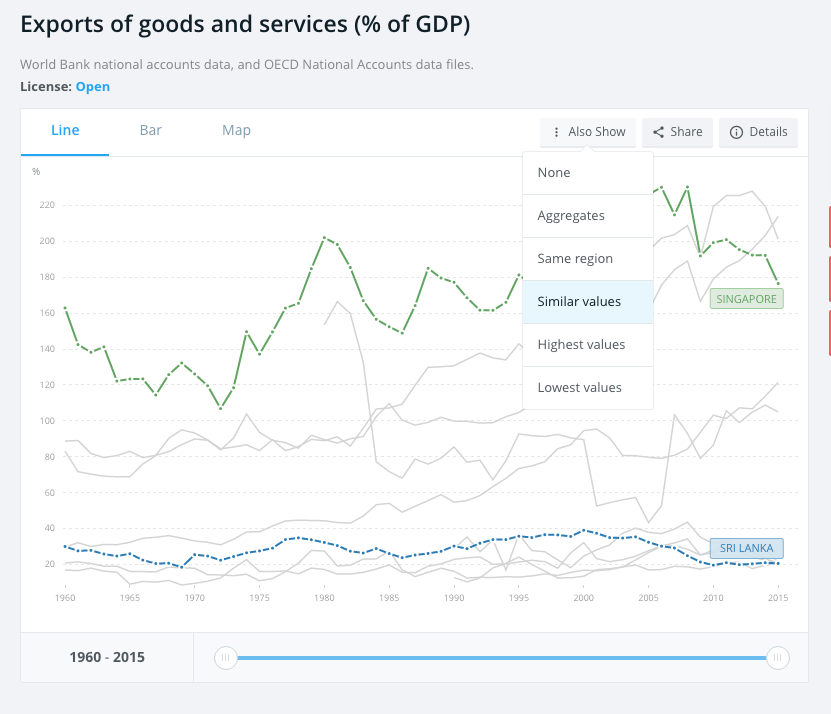
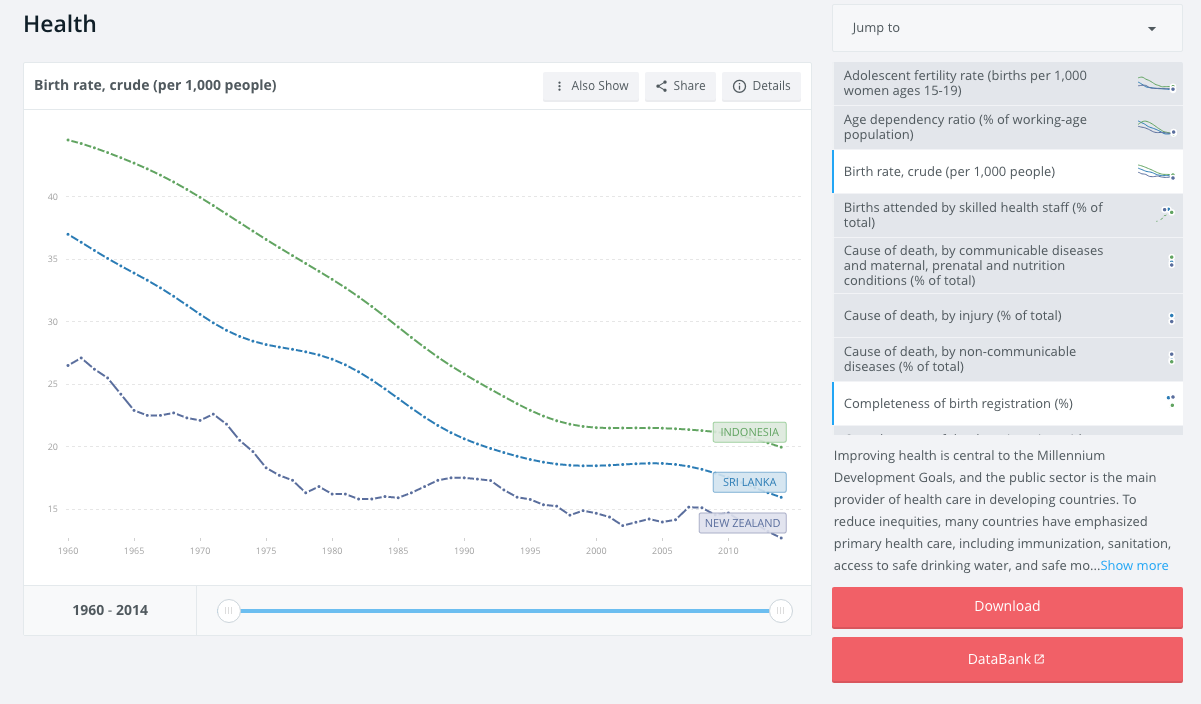
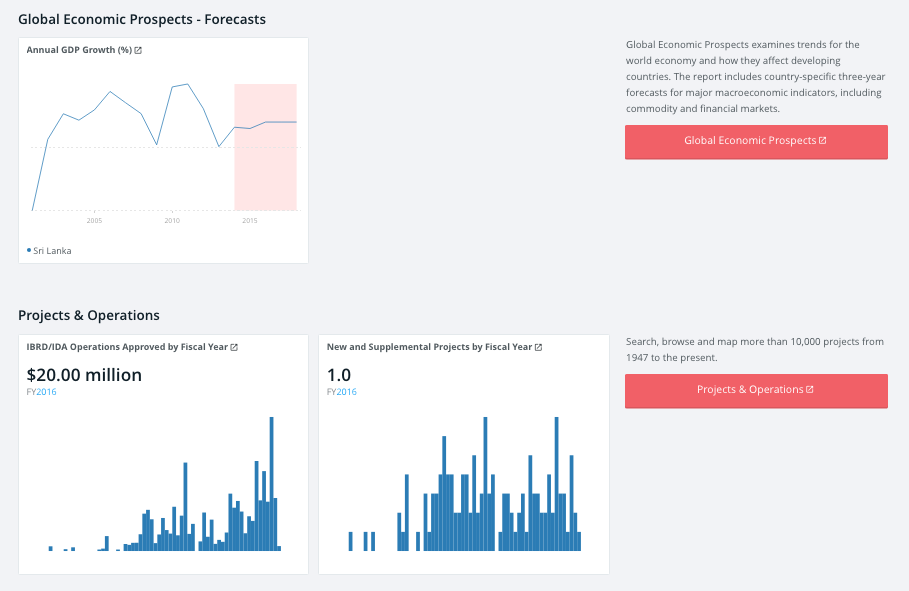
Falcor passes the data to the single page app using AJAX and we use the D3 library to create the charts for the given dataset. It’s a comprehensive chart library focused on displaying large data sets efficiently and has good support for displaying data on mobile devices. D3 also allows a lot of customisation, so it’s not so much plug-and-play, but it is definitely more powerful than many of the alternatives.
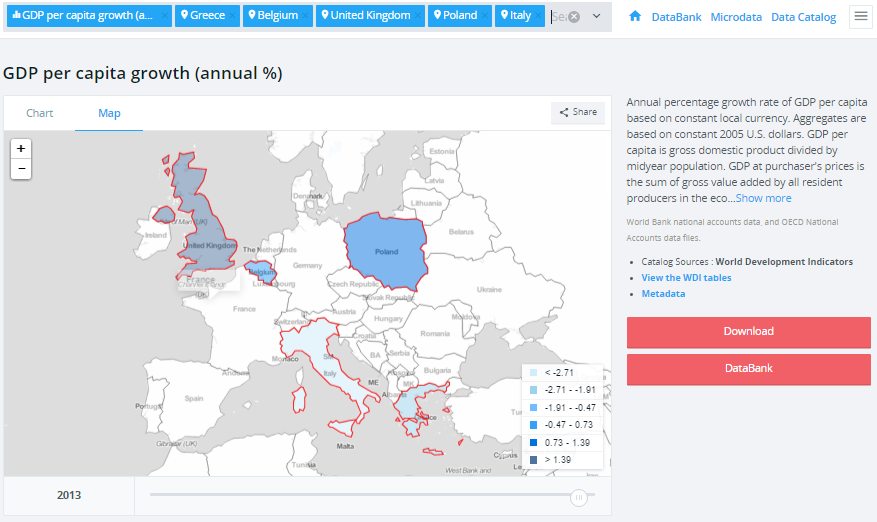
All the main pages are responsive and available to fit various mobile devices’ browsers, as well as larger desktop screens. The site also now supports the latest versions of Chrome, Safari, Firefox, and IE9+. We’re also using our open source egg SASS/Bourbon library to enable advanced widgets on the front page like video embeds and the preview mini-chart.
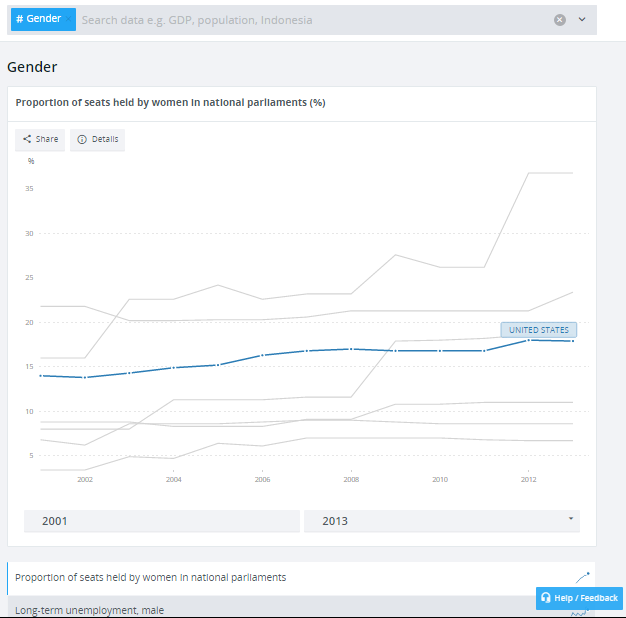
This upcoming site plays to the strengths of Node.js, Falcor and D3 in order to deliver highly relevant data visualizations from the World Bank’s Open Data API. We hope you like it and would love your feedback. Hit us up on Twitter or via email and share your thoughts with us!
Additional Case Study Details
Context
In May 2015, we commenced work on our biggest data-focused project to date. The World Bank’s data team hired us to rebuild their open data site, which is a repository and visualization engine for all of the Bank’s data, covering the world’s economies, finance, development, and much, much more.
The World Bank Group is an international financial institution that provides loans to developing countries for capital programs.
Challenges & Goals
Goals:
- Build a user-friendly data visualization website for public consumption
- Optimize a vast trove of data to be accessed easily, quickly, and on mobile
Challenges:
- Huge reams of data: the Bank continually collects an incredible amount of data and it all needs to be accessible on-demand
- Accessibility: this is an open data site, so the goal is to provide access to everyone
- Mobile: an increasing number of people are coming online for the first time using a mobile device
- Low bandwidth: an enormous amount of potential users live in areas without access to high-speed internet
- Multilingual: five core languages for the whole site and provide as many country pages as feasible in the native language
- Dynamic visualization: the charts and graphs aren’t universal, so we needed to find solutions to accurately present all of the data
Design Process
Due to the scale and importance of this project, the Wiredcraft team took its time thinking through designing the product. After hosting workshops with the World Bank’s team, we established a need for feature parity with the previous version of the website and key integration points with some of the World Bank’s other services (databank.worldbank.org & datacatalog.worldbank.org).
The key user personas for designing this product were:
- Academics
- Journalists
- International development staff
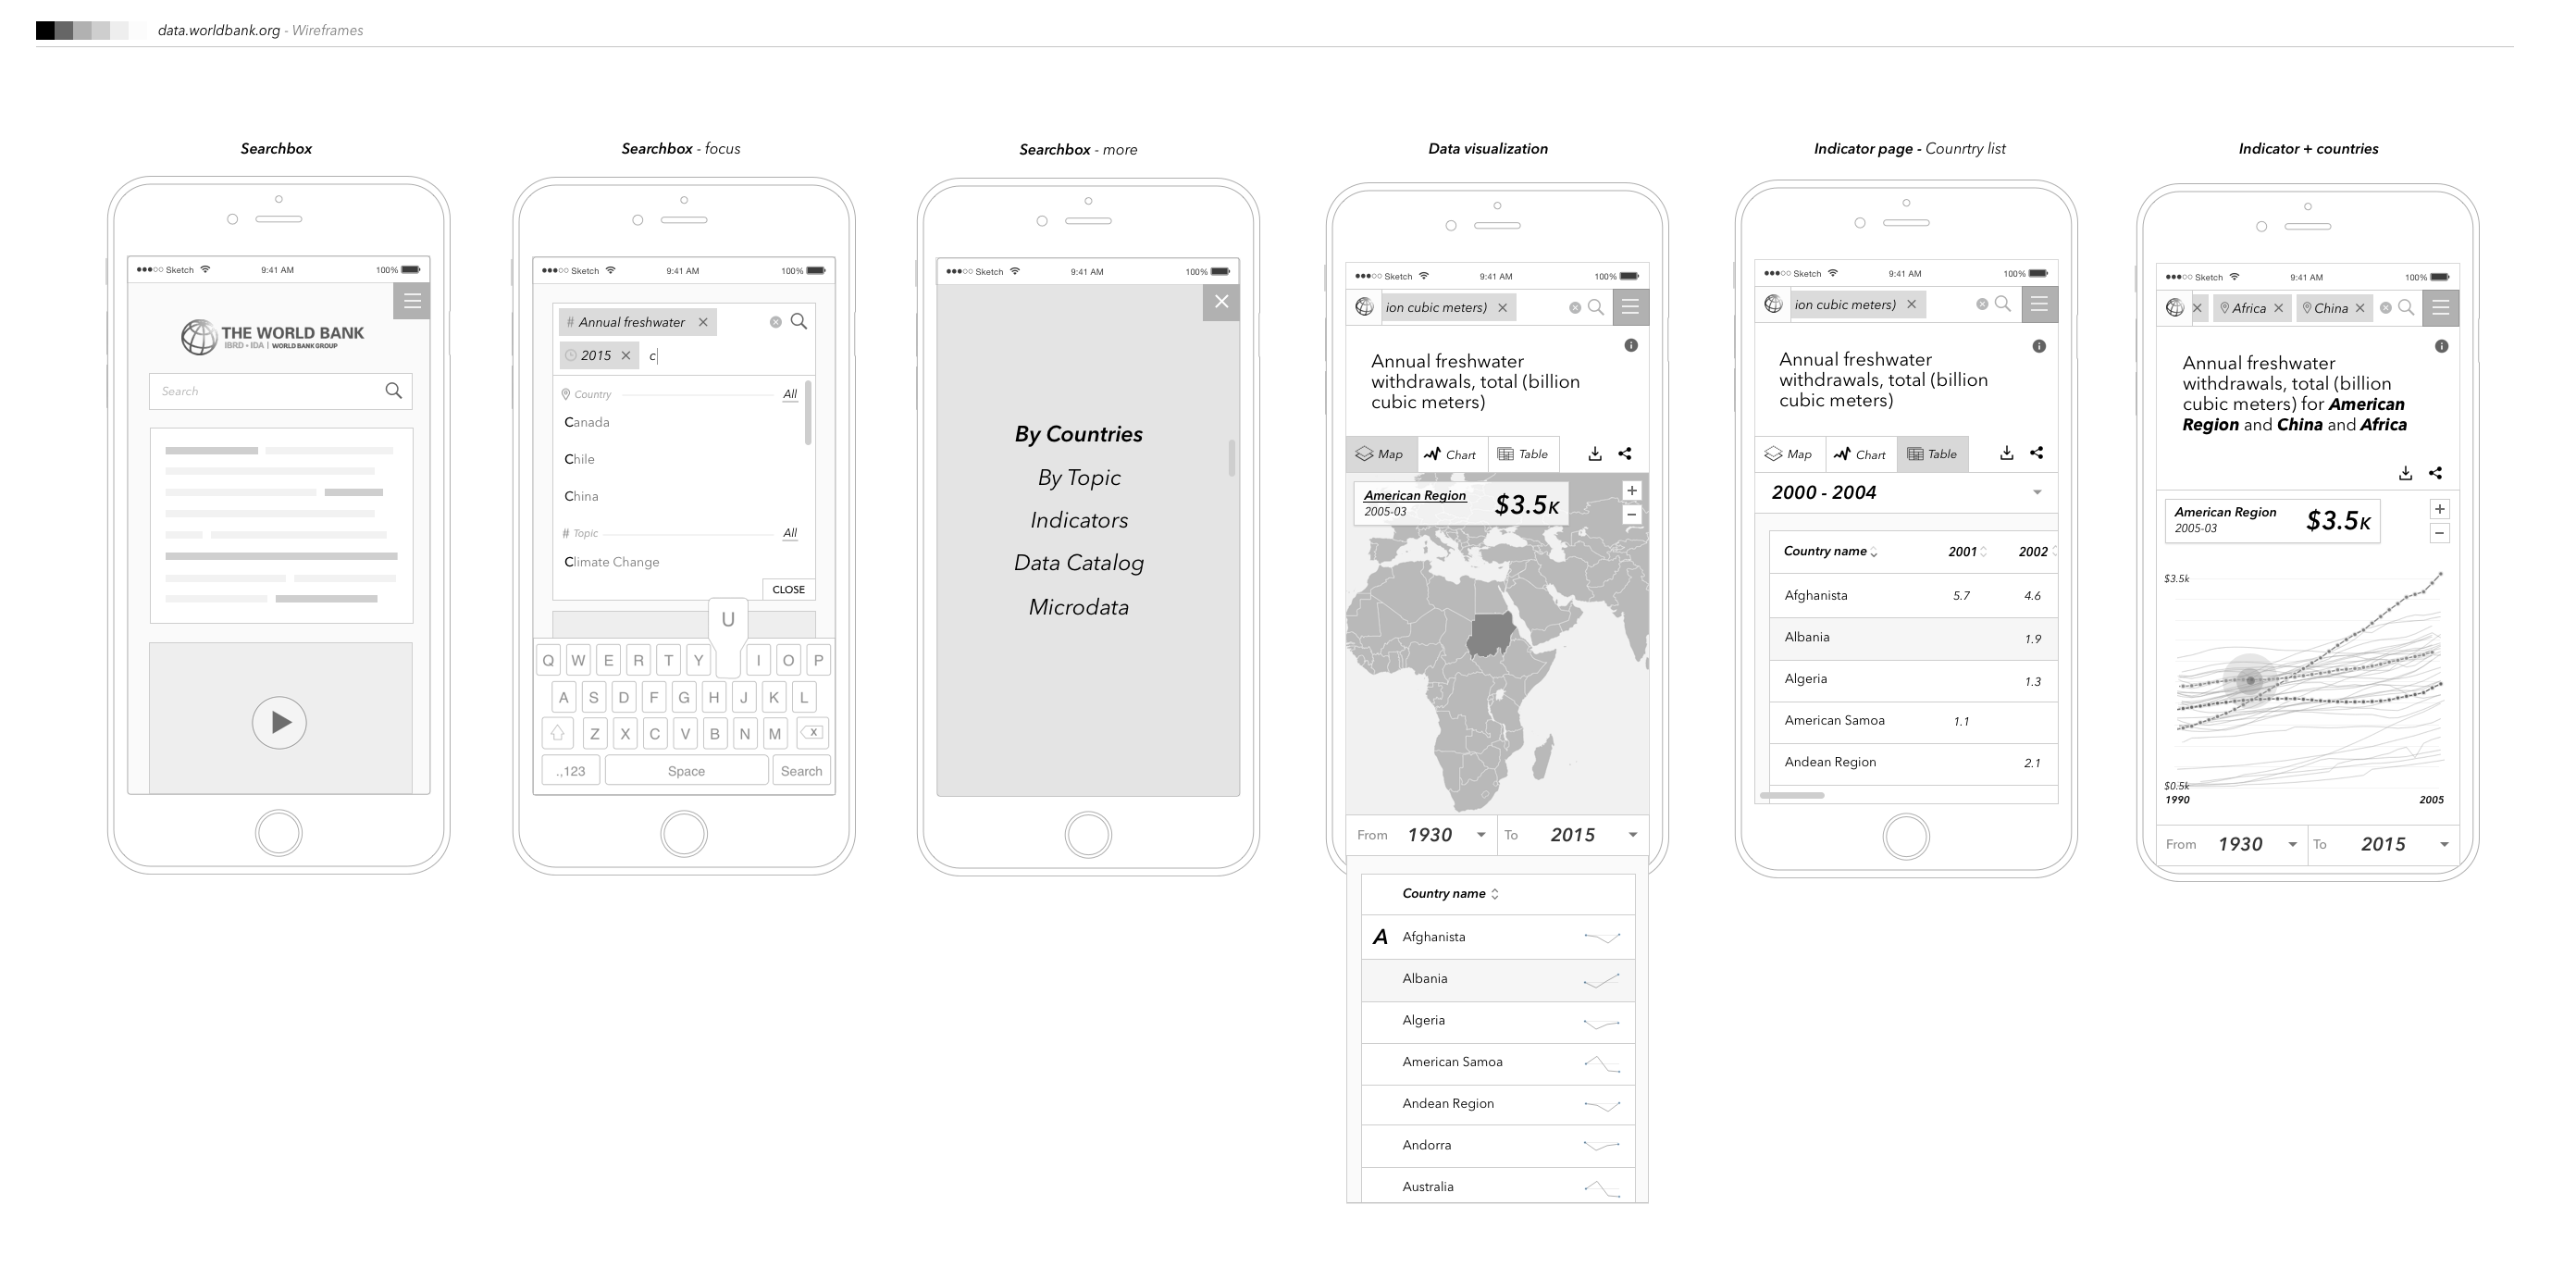
This is one of our initial wireframes, highlighting our core approach of building the site as a single-page, search-based app.
Metrics
- 9 months
- 3,283 Github commits
- 761 Github issues
- 3-months of public beta
- 1400 development indicators
Technology & Techniques
- Falcor: we used this new technology from Netflix to reduce data requests and speed up the dataflow
- Node.js: the backend is based on this technology
- Webpack: splitting the code with Webpack really cut down data requests (>50%) and decreased the initial load time for the app
- React: the frontend is based on this technology
- D3.js: we used this to create the visualizations
Takeaways
- We learned how work with a client quite literally on the other side of the world. World Bank HQ is in DC, which is 12 hours behind our Shanghai team.
- We’re old hands with data viz, but we learned a ton about accessibility and reducing load times and data requests
- Integrating new tech and practices isn’t easy, especially on the fly, but we identified good processes for testing new things and implementing them smoothly.
Read More
- World Bank Open Data Site is Officially Launched
- Relaunching the World Bank Open Data Platform with React and NodeJS
- Lightening the Load with FalcorJS
- Dashed Line Segmentation in D3JS
- Building the World Bank Data Site as a Fast-Loading, Single-Page App With Code Splitting
Work project: Rebuilding the World Bank’s open data site
Context
In May 2015, we commenced work on our biggest data-focused project to date. The World Bank’s data team hired us to rebuild their open data site, which is a repository and visualization engine for all of the Bank’s data, covering the world’s economies, finance, development, and much, much more.
The World Bank Group is an international financial institution that provides loans to developing countries for capital programs.
Challenges & Goals
Goals:
- Build a user-friendly data visualization website for public consumption
- Optimize a vast trove of data to be accessed easily, quickly, and on mobile
Challenges:
- Huge reams of data: the Bank continually collects an incredible amount of data and it all needs to be accessible on-demand
- Accessibility: this is an open data site, so the goal is to provide access to everyone
- Mobile: an increasing number of people are coming online for the first time using a mobile device
- Low bandwidth: an enormous amount of potential users live in areas without access to high-speed internet
- Multilingual: five core languages for the whole site and provide as many country pages as feasible in the native language
- Dynamic visualization: the charts and graphs aren’t universal, so we needed to find solutions to accurately present all of the data
Design Process
Due to the scale and importance of this project, the Wiredcraft team took its time thinking through designing the product. After hosting workshops with the World Bank’s team, we established a need for feature parity with the previous version of the website and key integration points with some of the World Bank’s other services (databank.worldbank.org & datacatalog.worldbank.org).
The key user personas for designing this product were:
- Academics
- Journalists
- International development staff
This is one of our initial wireframes, highlighting our core approach of building the site as a single-page, search-based app.
Metrics
- 9 months
- 3,283 Github commits
- 761 Github issues
- 3-months of public beta
- 1400 development indicators
Technology & Techniques
- Falcor: we used this new technology from Netflix to reduce data requests and speed up the dataflow
- Node.js: the backend is based on this technology
- Webpack: splitting the code with Webpack really cut down data requests (>50%) and decreased the initial load time for the app
- React: the frontend is based on this technology
- D3.js: we used this to create the visualizations
Takeaways
- We learned how work with a client quite literally on the other side of the world. World Bank HQ is in DC, which is 12 hours behind our Shanghai team.
- We’re old hands with data viz, but we learned a ton about accessibility and reducing load times and data requests
- Integrating new tech and practices isn’t easy, especially on the fly, but we identified good processes for testing new things and implementing them smoothly.