The Southern Sudan Referendum
Building the voter registration and results management software for the 2011 Southern Sudan Referendum
Secession or Unity in Sudan
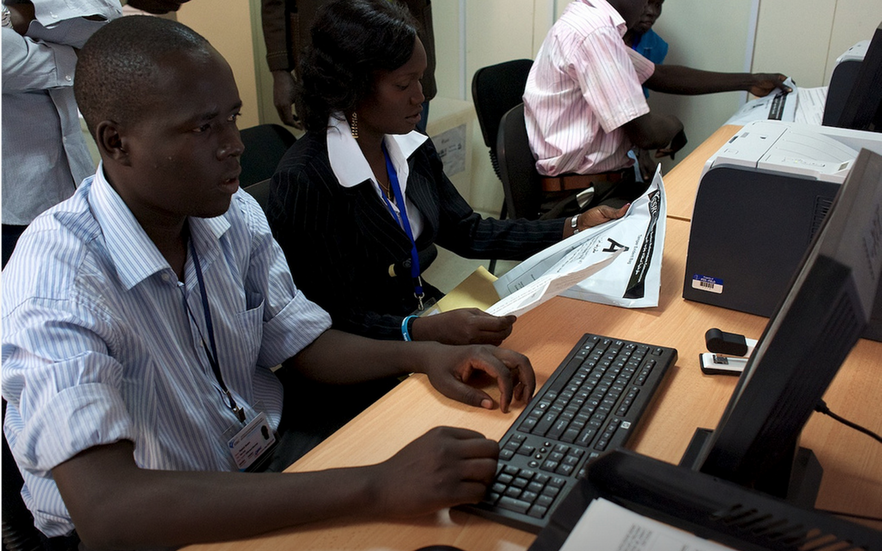
The relics of colonial Africa left Sudan culturally and geographically distant. After years of war Sudan turned to democracy as a solution. In 2011 IFES helped the local SSRB and SSRC (respectively the Southern Sudan Referendum Bureau and Southern Sudan Referendum Commission) to host a referendum. The challenge was to plan and implement the secure and valid collection of data from registration to results.
Working directly with IFES and the referendum authorities, we designed and deployed 3 platforms; 2 data collection applications for both registration and result entries, and the official results website. We implemented data integrity checks to ensure security and accuracy during data collection. Leveraging our technical chops we helped on the ground in Juba, Sudan to supervise deployment and fast iterations to ensure vote validity during the referendum. The referendum ultimately led to the creation of the newest country and the 193 United Nations member state.
Data
- January 9-15th 2011
- 3.8 million Southern Sudanese Voters
- 3,851,994 Votes Cast
- 97.58% Voter turnout
- 2,893 Referendum Centers
- 2 Datacenters in Juba and Karthoum
Priorities for IFES
- Security and accuracy of the referendum ballots.
- Flexibility, we needed a system that would allow the local staff to update in real time.
- Data integrity. Provided by a double validation process.
- Monitoring metrics to look for trends and progress
Designing for accuracy and speed
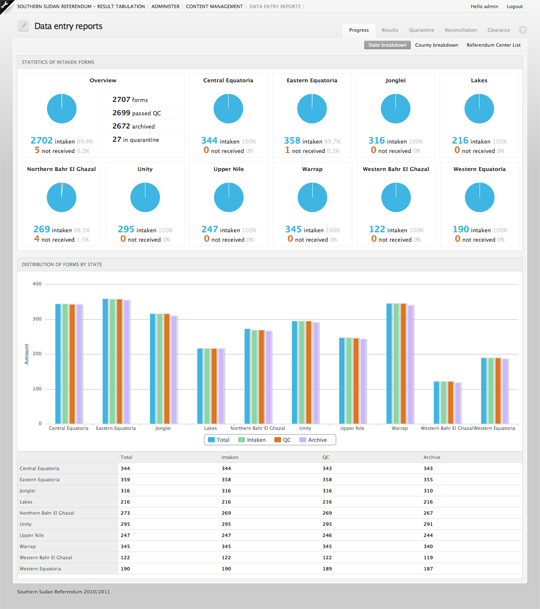
The results tabulation platform was designed to allow the collected data as raw CSV files to be updated directly to the website by a team member from Wiredcraft or IFES. Making it possible to quickly extract the up-to-date information in a format that was easy to manipulate by the multiple on the ground teams.
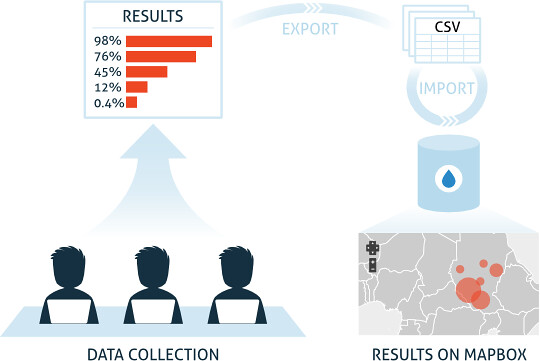
We crafted a series of high level dashboards, aggregating overviews and details of various metrics allowing technicians and managers to follow trends and metrics. The teams could monitor various trends and progress of metrics: gender and geographic distributions, percentages of processed data against expected volumes, amounts of forms in the states collection workflow, etc.
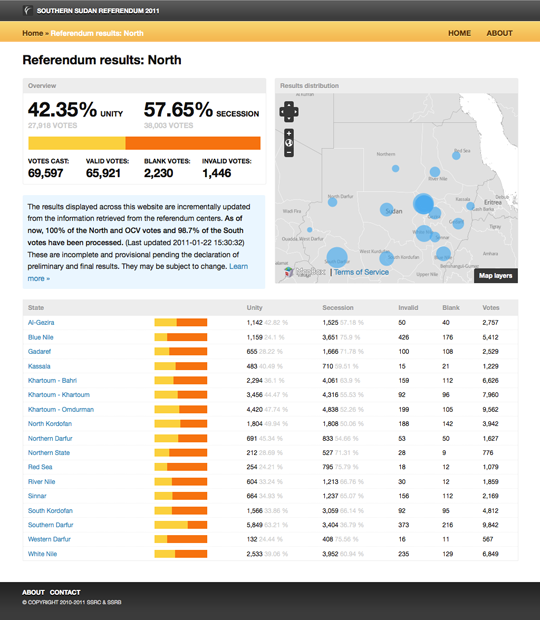
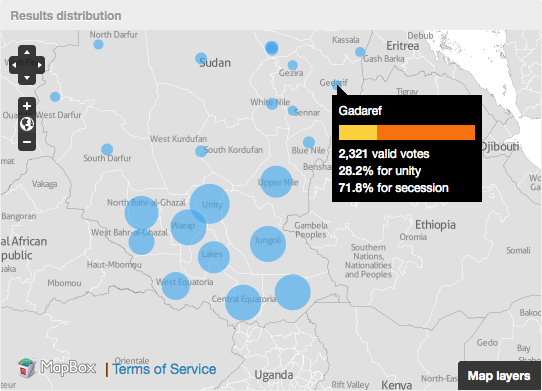
The design of the results website implemented a simple and consistent color theme making it clear to analyze the results of the referendum. Leveraging lists, graphs, raw data, and maps to visualize the metrics from the outcome of the election at various levels (country, region, state and county). The visualization of the vote distribution from the local referendum centers was made using Openlayers and custom Mapbox tiles.
Under the Hood
- Leveraging Drupal as a real software development platform, not just as a content management system.
- Utilizing Features, Strongarm, Context and Profiler to ship the project as a fully functional install profile.
- Building dashboards and graphics with [HighCharts] (http://www.highcharts.com/) JavaScript library.
- Maps with Mapbox and Openlayers.
Takeaway
We were able to provide a system that allowed for quick iterations after each update and validation of the votes. The results page provided real-time updates and allowed for easy understanding of voter distribuition and trends. The South Sudan Referendum led to over 98% approval of secession and South Sudan becoming an independent state in July of 2011.