7 Technologies Changing the Way We Know Water
Water is one of the most important and overlooked resources. The Stockholm International Water Institute hosts the World Water Week each year to help bring to light the importance of our water resources.
The 25th World Water Week “Water for Development” kicked off yesterday.
We are supporting World Water Week by taking a look at technologies that are changing the way we know our water.
Featuring seven projects with various features that are shaping how we view our water resources from an open source hardware to monitor water, mapping flooding and droughts, to water collection and quality etc…
7 Technologies That Are Helping You Know Your Water Better
Mwater
Keeping data off paper (where data goes to die), mWater is on a mission to end water-born disease. They provide open access to water monitoring and evaluation through their mobile application. You can access the app online or on an Android device. They’ll be presenting their project on Wednesday at World Water Week in Stockholm.
WRI Aqueduct Global Flood Analyzer Tool
The WRI Global Flood Analyzer Tool provides information on flood risks worldwide. The tool also provides predictions of current and future flood risks based on various flood protection levels. The tool is bringing awareness of flood risks and climate change free of charge. You can see more on building the Global Flood Analyzer Tool here

Open Waters: Open Source Water Quality Data Management System
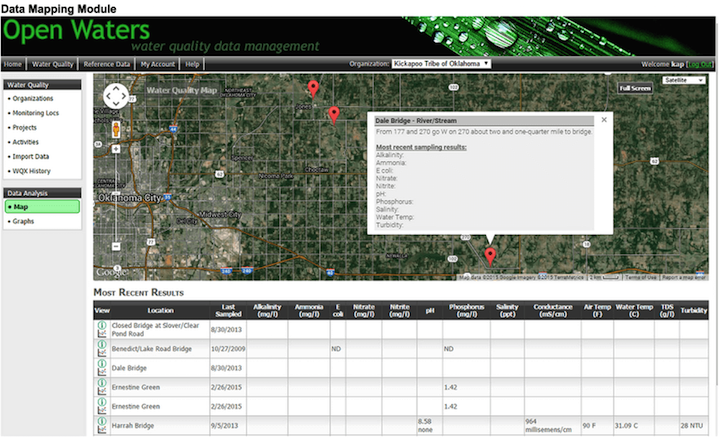
Open source and free this project allows you to manage monitoring locations, samples, projects, and results locally. You don’t have to worry about updating the EPA because with this system it’s automated.
Warka Water Tower
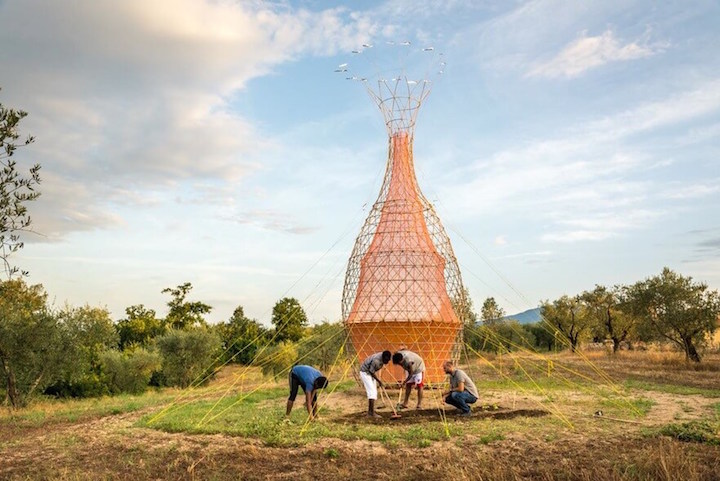
Warka Water project was started in 2012 by Italian Designer Arturo Vittori. They installed the first working prototype in Ethiopia this year. The project aims to provide potable water with a low maintenance design. The daily water collection from the Warka Tower is 13 to 26 gallons. You can support the Warka Water Tower on KickStarter
USGS California Drought Visualization and Daily Stream Flow Conditions
United States Geological Survey provides both the Drought Visualization and the Daily Stream Flow Conditions. The drought visualization shows the effect on more than 56 reservoirs in California from Jan 2011 to date: identifying the effects on snowpack, surface area, and stream and river flows. The project is open source and you can fork it on GitHub.
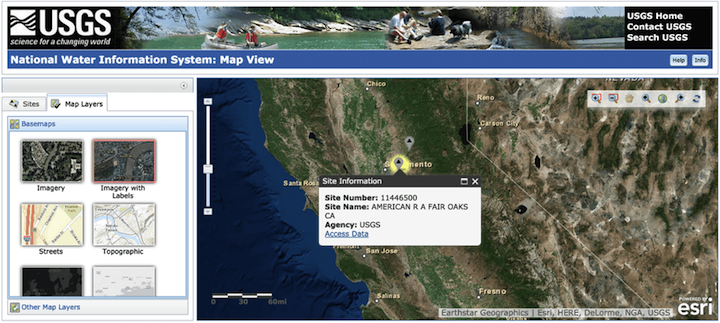
The Daily Stream Flow allows you to select from various parameters from water level and flow, water quality, metrological properties and physical properties. You then have a few options how to present your results in map form with various mapping layers or in list format.
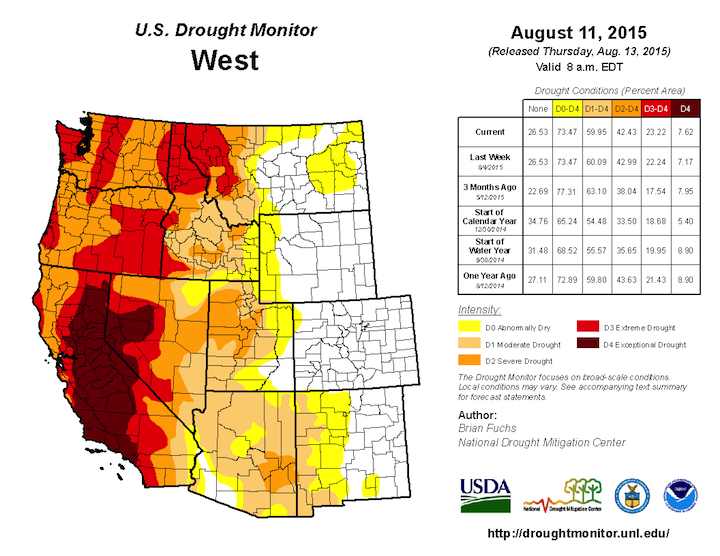
US Drought Monitor
The national drought mitigation centerProvides a weekly interactive map and drought analysis for the US. The map provides information on a national and regional scale. There is also access to tabular data for statistical analysis.
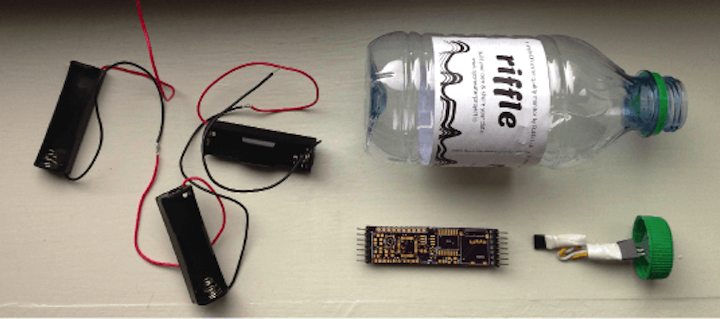
RIFFLE: Remote Independent Friendly Field-Logger Electronics
An open source hardware item that is working towards providing a reliable way to measure water quality through water quality through water temperature, conductivity, depth, and turbidity (all of these are indicators for potential pollutants). The project is focusing on an Arduino-compatible board and will fit inside of a plastic water bottle.
“The wars of the future will be fought over water.” - Kelly Sanders
Water is one of the most important resources we have. As we continue to face higher levels of pollutants and climate change this resource becomes more and more precious. Low and high technologies are helping us to know our water resources better, so that we can make the right choices in water conservation, sourcing and monitoring.
Do you know of any great water projects? Let us know on Twitter.
