Understanding Enhanced Ecommerce reports in Google Analytics
Q&A session on some common questions regarding Ecommerce reports on Google Analytics.
Google Analytics’ Enhanced Ecommerce tracking gives you the ability to track ecommerce activities using an out-of-the-box solution, and provides you insights that can help improve your conversion rate.
However, the ecommerce reports can be hard to understand.
In this article, I’m listing some common questions our clients had when we first started looking at ecommerce reports. Hopefully this can save you some confusion.
(All figures come from Demo Account of Google Merchandise Store data in January, 2019)
The Ecommerce Conversion Rate is 0.12%, meaning 0.12% of users have purchased?
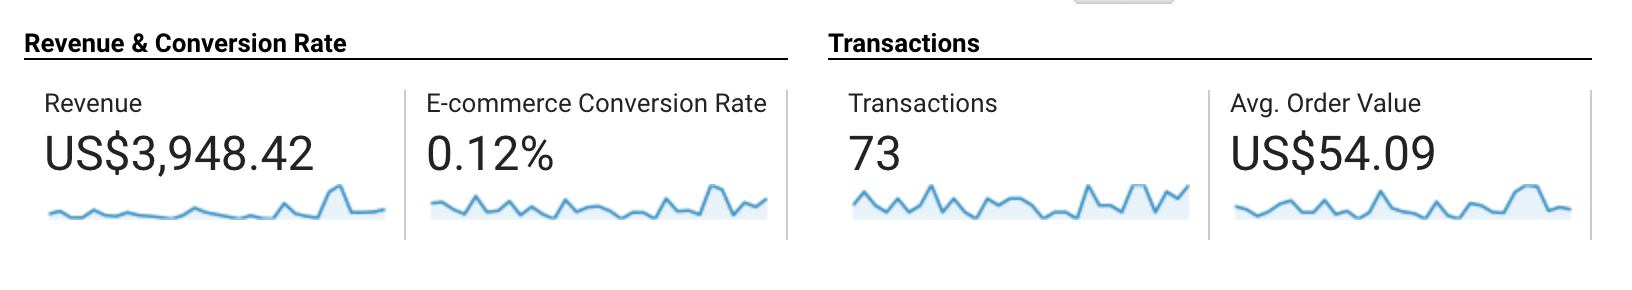
No.
The conversion rate given by Google Analytics is at session-level, not user-level. The number here actually means purchase activity is included in 0.12% of all sessions. How many users generated these sessions is however unknown.
Then what’s the difference between ecommerce conversion rate at session-level and user-level?
Here’s an example. I visited Amazon last Monday, but didn’t buy anything. I then visited Amazon again last Tuesday, and bought a bag. So I am one user who has generated two sessions and one purchase. If we were looking at my data alone, the session-level ecommerce conversion rate would be 50%, but the user-level ecommerce conversion rate would be 100%.
So you can see the data you think you are seeing can be quite far away from what Google Analytics is displaying by default.
To understand how large this gap can be, and how you can instead get user-level conversion data from Google Analytics, read this article from Conversionista, knowledge guaranteed.
Something doesn’t look right. Buy-to-Detail Rate is over 100%!
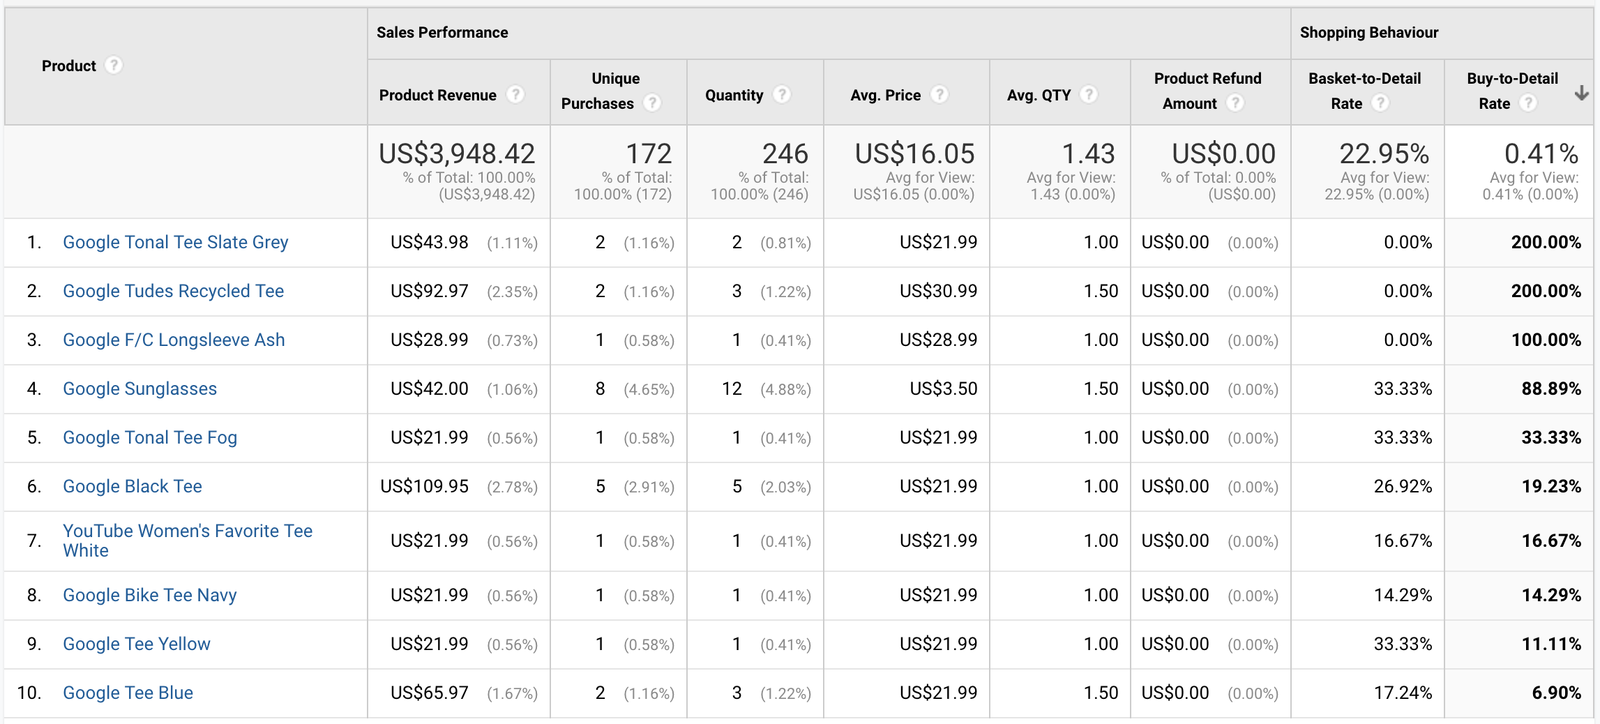
It tends to scare me when I see a ratio that exceeds 100%.
Like 200% Buy-to-Detail Rate displayed in the above report.
But, I really should calm down and think about how the ratio is calculated, and the nature of the website/app we’re measuring. And yes, ratios can be over 100%.
So let’s look at Buy-to-Detail Rate. It’s the conversion rate from Product Detail Views to Unique Purchases. But then why is Product Detail Views sometimes smaller than Unique Purchases?
This is when one should go back and look at the shopping flow being tracked. Does a customer have to visit the product detail page before purchasing a product? It’s increasingly common to be able to checkout a product directly without seeing its detail or even adding it to shopping bag.
Always dive deep into the products. It’s hard to understand how the product performs without really knowing what it offers and how it does that.
Can you show me Total Purchases instead of Unique Purchases?
I’ve been asked about this quite a lot, especially by people who don’t learn about this metric from Google Analytics report directly. When they say ‘Total Purchases’, they usually mean how many units of products were sold.
Metrics starting with “Unique…” seem to remind people of a pair of metrics used very often - Unique Events and Total Events, where the former means the number of sessions that include an event, and the latter means the number of events that have occurred.
Can this definition be applied to Unique Purchases? No.
In fact, Unique Purchases is linked to products. It is not sessions with purchase of a specific product, but transactions that include a specific product. If transaction A includes 1 red bag, then 1 unique purchase for red bag it is. If transaction B includes 3 red bags, then still 1 unique purchase for red bag.
Exactly how many units of a product are sold is of no concern to the metric Unique Purchases, but still, it is possible to find out. Just go check the Quantity metric in the Product Performance report instead.
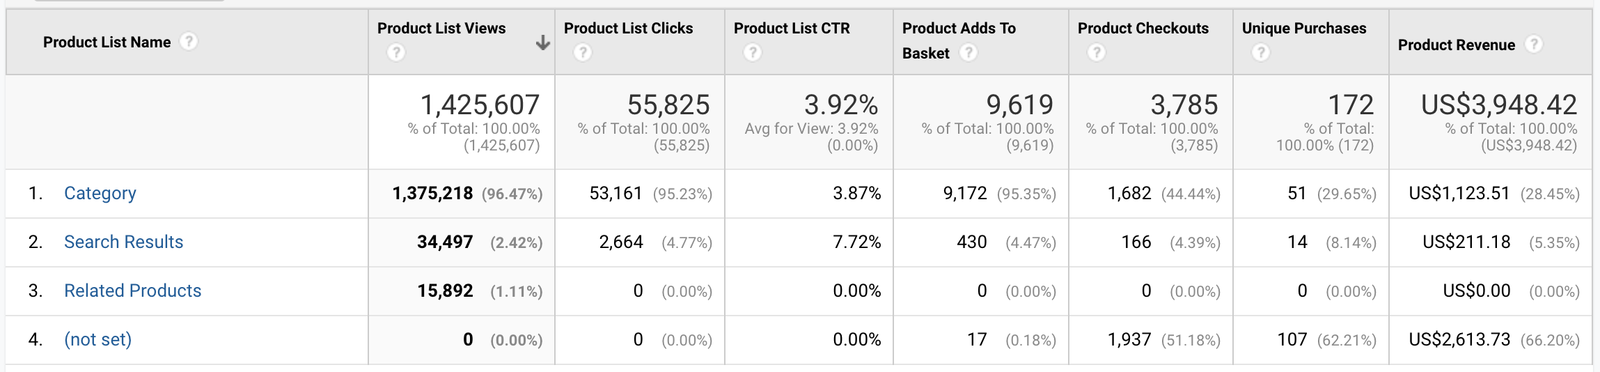
Product List Views and Product Detail Views, what are they?
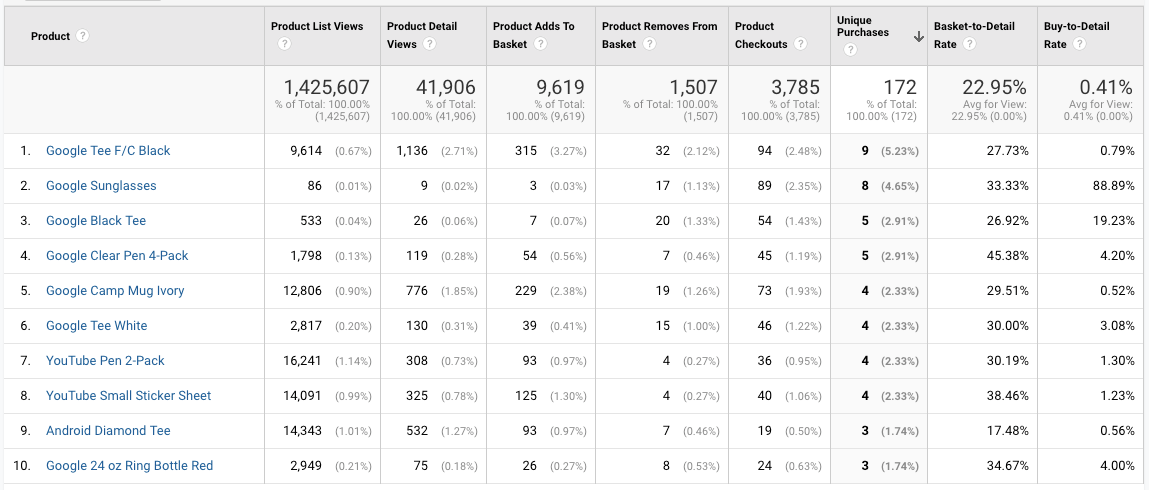
Product Detail Views is quite self-explanatory, meaning the number of views of a product detail page. However, people can have a hard time understanding Product List Views when they first see this metric.
I find it often easier for others to understand when I explain Product List Views as how many times a product is displayed in a list. This is an impression metric. Users don’t have to view, click, or interact with anything on screen to trigger it. Once a product is displayed, it has a Product List View tracked.
With Product List Views and Product List Clicks, Product List CTR is easily calculated, and lets you know what lists have better exposure, what lists tend to attract “window-shoppers”.
Conclusion
So I’ve listed some questions I came across along the way, what are the things I’ve learned?
- Decide whether to look at session-level or user-level data wisely.
- Understand your total shopping flow before diving into the data.
- When in doubt, refer to Google Analytics’ extensive documentation. Dimensions & Metrics Explorer is a good place to start.
Stay tuned
Follow our newsletter or our WeChat account; every other week you'll receive news about what we're up to, our events and our insights on digital products, omnichannel, cross-border ecommerce or whatever the team fancies.
-
Add us on WeChat

-
Subscribe to our newsletter