Enhancing an Open Data platform with choropleth mapping techniques and third-party services
In 2012 we completed phase one of EMBARQ”s data visualization platform: BRTdata.org. Embarq wanted to improve their ability to collect, analyze, and share BRT systems data with internal resources and the wider public. Wiredcraft worked with Embarq to develop and deploy an open data platform supporting this goal.
Reimagining data visualization
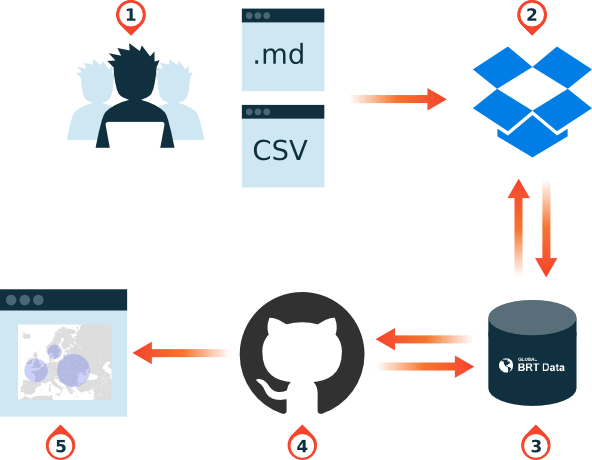
One year later EMBARQ enlisted Wiredcraft to revisit BRTdata.org”s user experience, data visualizations, and content publishing workflows. During phase one we built maps using Mapbox. While Mapbox is a powerful tool, visualizing data within dynamically generated boundaries was difficult. A year in, the indicator list had grown unmanageable and difficult for users to navigate. Publishing content to the site could use a hand as well. We developed ways to optimize the automatic data deployment workflow using Dropbox and GitHub. The following diagram outlines this new workflow:

- User generated content: Embarq”s staff creates content as Markdown or CSV files.
- Dropbox shared folders: data synced and accessible across Embarq staff managing site content.
- “Worker”: generates static assets with files synchronized from Dropbox and pushes them to Github.
- Github: hosts the website as a Github page.
- BRTdata.org: the BRTdata website.
We leveraged third-party services to reduce the complexity and heavy lifting associated with building and maintaining an open online data platform. Dropbox provides storage and streamlined content management while GitHub hosts the website and posts the static assets. We developed a method where files on Dropbox are pushed to GitHub and then rendered as the final standalone website. In this case, BRTdata.org.
Working with the EMBARQ team we prioritized the following improvements:
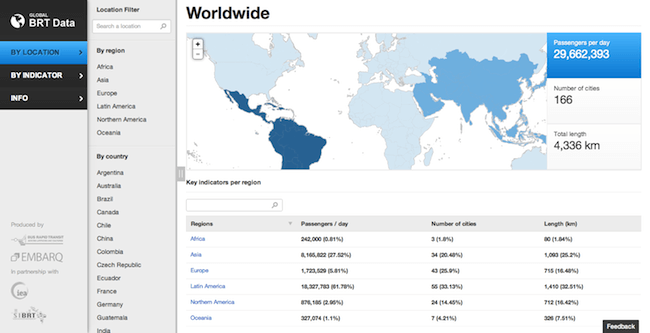
Re-architecture of the maps data with choropleth layers using CartoDB. Implementation of filters to better parse increasingly granular data sets. Rebuilding the front-end with AngularJS to improve site performance and speed up data binding. Integrated third-party APIs to improve site performance and simplify back-end processes.
Reduced Complexity and Increased Performance
Our solutions brought about two awesome outcomes: a better user experience and simpler site management for administrators.
Users were treated to dynamic map visualizations that more clearly delineated the data sets they were interested in exploring. And administrators no longer needed technical skills to manage the site: just drag and drop Markdown or CSV files to edit content or manage data. BRTdata.org is now easier to explore on the front-end and even easier to manage on the back-end.

Integrating third-party services (Dropbox and GitHub) and adopting CartoDB”s flexible mapping tools allowed Wiredcraft to focus on reinforcing a lean site infrastructure while enhancing a compelling user experience.