
We like to work on things that matter, this sometimes translates into building data visualizations allowing you to better understand and explore Open Data. We often work with the World Bank and recently had the opportunity to work on a product that will soon let you visualize and access the World Bank’s sub-national Open Data. This means you will be able to dive into poverty or nutrition issues worldwide at a regional level.
We believe it to be a big deal for the international development community at large; most Open Data available out there is collected and represented at a national level, and rarely is more granular. We hope that the release of this tool will mean better informed policy-makers and public individuals, helping the World Bank in its fight against poverty and for nutrition.
We built a very flexible tool that will allow for expansion as more sub-national data becomes available. Keep in mind however that the data is collected differently in each country, thus comparison is limited to each country (for now).
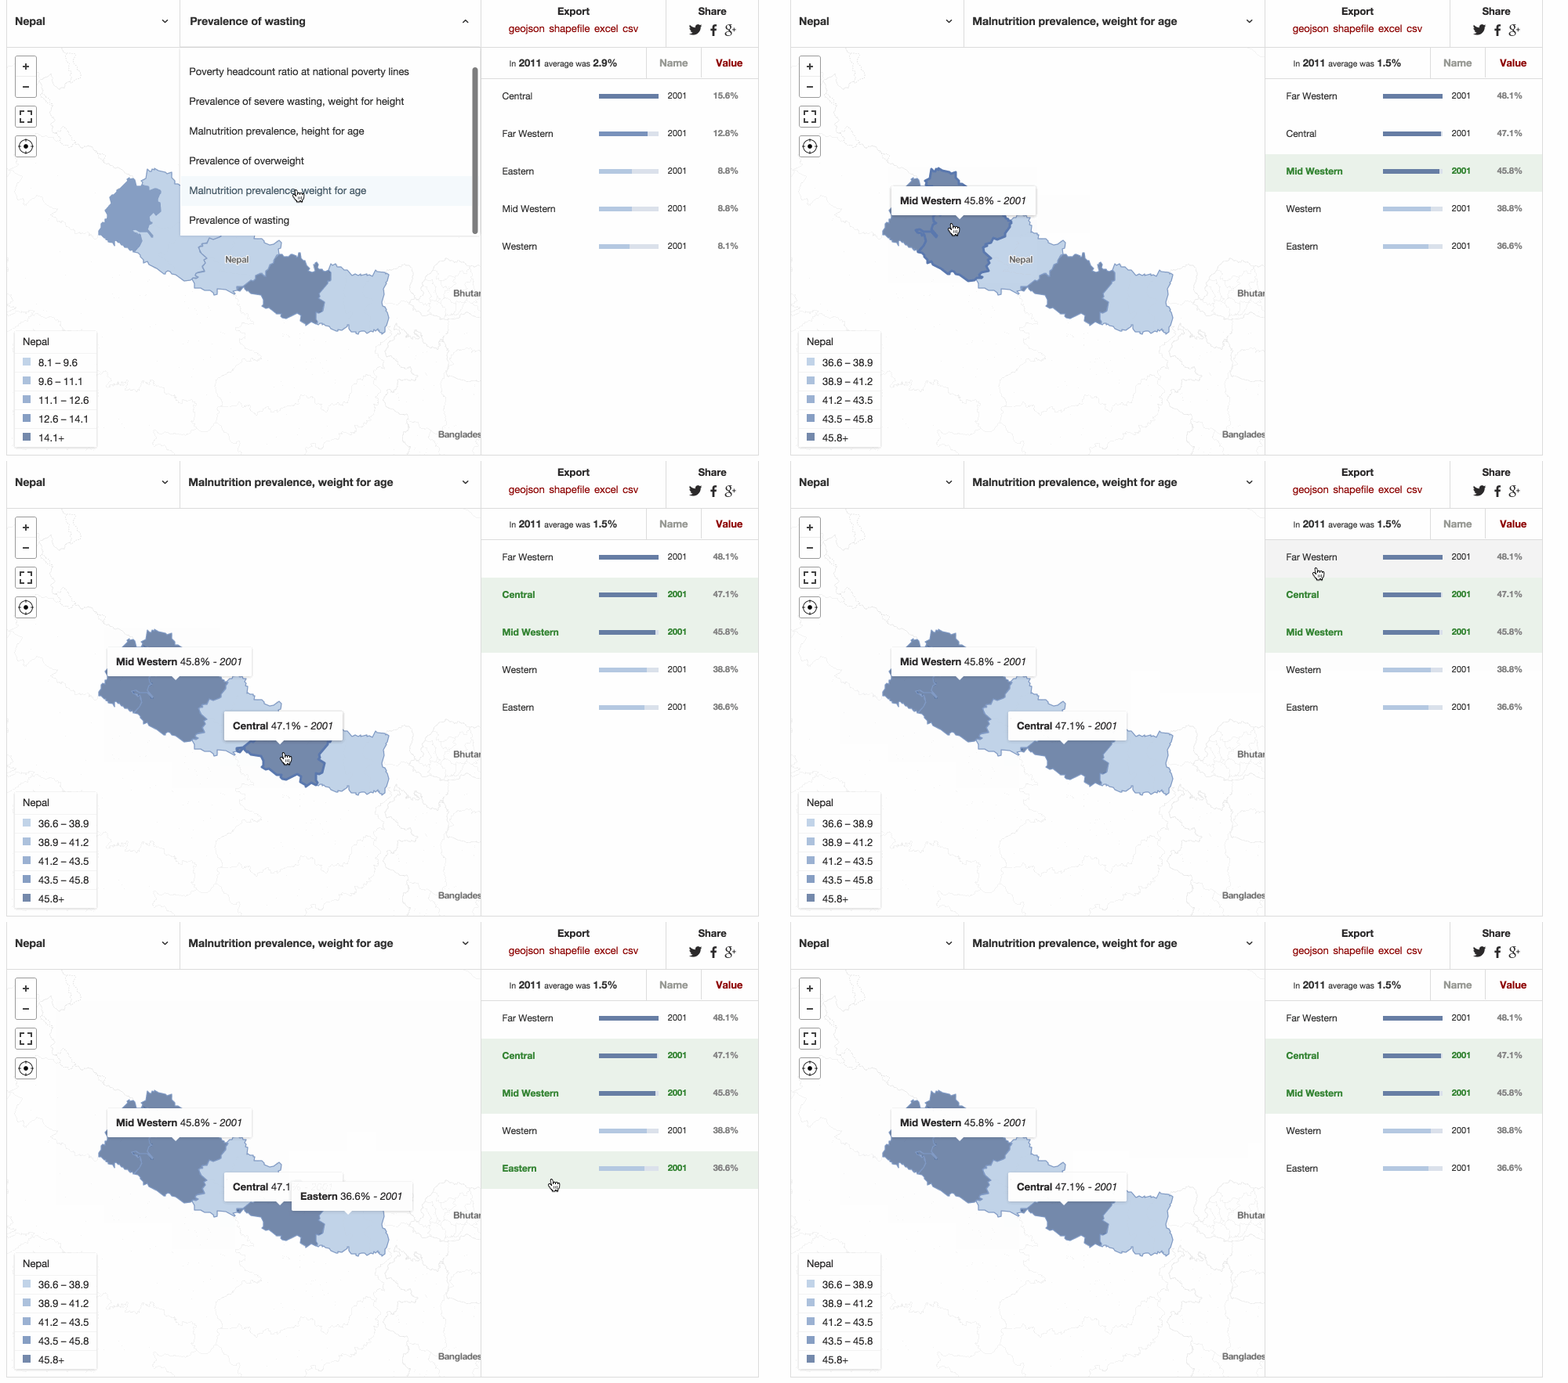 The subnational app at work with data from Nepal
Our technical approach for this product was focused on simplicity; we prove once again that static application are a quick and secure way to build elegant solutions that scale to millions and are easy to maintain. Through the development the entire platform was hosted on GitHub pages.
We can’t wait to launch it and see how the international development community uses it. We hope to learn more from its users as we kick off the redesign of data.worldbank.org (for more on this, stay tuned).
Additional Case Study Details
The world Bank is a major player in the Open Data arena. Its main data website, data.worldbank.org, gives free access to thousands of indicators about development in countries around the globe. The World Bank however has collected data at sub-national level and came to Wiredcraft to help them integrate this data into their current platform and explore novel technical approaches to publish data.
The client
The World Bank is a United Nations international financial institution that provides loans to developing countries for capital programs. Its official goal is the reduction of poverty.
Challenges
- Simple UI and UX focusing on simple navigation and responsiveness based on the World Banks guidelines.
- Zoom levels for the Map having varying levels of detail based on the zoom level.
- Scalability we utilized a static app to make sure that the large dataset can scale.
- Integration with the exsisting style of the World Bank.
- Compatibility of Information. Integration with the APIS of the World Bank.
Designing for simplicity
We provided a simple UI design layout with most of the real eastate dedicated to the map. We incorporated teh indicator and country selection as a dropdown menu. The sidebar provided additional information and lists the subnational separation for the selected country. The header and footer for the application were provided directly by the World Bank. The frontend was implemented using Angular.js.
We focused on visualizing one country at a time and integrated the exsisiting World Bank style in to our data visualization. This was especially important for the design and style of the basemap. We wanted the application to focus on interactivity, so once a country is selected the user can manipulate and interpret to customize the information in the visualization. THe geo-data information about the sub-national areas were provided by the client.
A radically different technical approach
The technology aspect was a strong departure from the existing data.worldbank.org website:
-
A static client with Angular.js and Mapbox.js on GitHub pages. We often build our apps as a combination of a static client and a JSON RESTful API. This one was no exception, and even took on to make the API static as well, allowing us to host the whole thing on GitHub pages.
-
A static API with Python. We used Python to handle the data crunching, fetching data from the World Bank’s API and preparing a static API composed of JSON and GeoJSON files for the front-end to consume. This static API was hosted alongside our client as a GitHub page.
-
Data visualization & Maps with Tilemill and Mapbox. We prepared a set of custom base maps with Tilemill, reflecting the Bank’s official position on international borders, with the choropleths being a simple geojson displayed on top of it. As for all our maps, we hosted it on Mapbox.
-
Infrastructure management with devo.ps. Devo.ps, Wiredcraft’s server management solution, was the central piece to manage everything infrastructure: from continuous deployment to server configuration.
##Takeaway
Static applications are here to stay
With this app, we demonstrated one more time that static apps (both front-end and backend) can often superior alternatives to heavy dynamic applications.
The transition from a Drupal powered platform, which requires very specific knowledge and a lot of development resources, to a duo of lightweight applications which require little to no specific knowledge proved powerful:
- Secure and low maintenance. We were able to host the entire app, save for the data crunching worker, on GitHub Pages as a set of static files. There is nothing to hack and scaling the app is several orders of magnitude easier than with anything else.
- Low technical barriers to entry. The app is composed of straight Javascript libraries, HTML and SASS. The worker is built with regular Python. Anybody with access to Google could contribute to this app in under a hour.
- More time for experimentation, strategy and design. An indirect benefit of this approach is that it allows for quick, inexpensive experimentations and leaves more resources for strategy and design. We’re big proponents of the open source momvement.
We’re excited to see the World Bank experimenting with new technical approaches and look forward to seeing what people will build with these sub-national data sets.
Work project: Sub-National Open Data App for the World Bank
The world Bank is a major player in the Open Data arena. Its main data website, data.worldbank.org, gives free access to thousands of indicators about development in countries around the globe. The World Bank however has collected data at sub-national level and came to Wiredcraft to help them integrate this data into their current platform and explore novel technical approaches to publish data.
The client
The World Bank is a United Nations international financial institution that provides loans to developing countries for capital programs. Its official goal is the reduction of poverty.
Challenges
- Simple UI and UX focusing on simple navigation and responsiveness based on the World Banks guidelines.
- Zoom levels for the Map having varying levels of detail based on the zoom level.
- Scalability we utilized a static app to make sure that the large dataset can scale.
- Integration with the exsisting style of the World Bank.
- Compatibility of Information. Integration with the APIS of the World Bank.
Designing for simplicity
We provided a simple UI design layout with most of the real eastate dedicated to the map. We incorporated teh indicator and country selection as a dropdown menu. The sidebar provided additional information and lists the subnational separation for the selected country. The header and footer for the application were provided directly by the World Bank. The frontend was implemented using Angular.js.
We focused on visualizing one country at a time and integrated the exsisiting World Bank style in to our data visualization. This was especially important for the design and style of the basemap. We wanted the application to focus on interactivity, so once a country is selected the user can manipulate and interpret to customize the information in the visualization. THe geo-data information about the sub-national areas were provided by the client.
A radically different technical approach
The technology aspect was a strong departure from the existing data.worldbank.org website:
-
A static client with Angular.js and Mapbox.js on GitHub pages. We often build our apps as a combination of a static client and a JSON RESTful API. This one was no exception, and even took on to make the API static as well, allowing us to host the whole thing on GitHub pages.
-
A static API with Python. We used Python to handle the data crunching, fetching data from the World Bank’s API and preparing a static API composed of JSON and GeoJSON files for the front-end to consume. This static API was hosted alongside our client as a GitHub page.
-
Data visualization & Maps with Tilemill and Mapbox. We prepared a set of custom base maps with Tilemill, reflecting the Bank’s official position on international borders, with the choropleths being a simple geojson displayed on top of it. As for all our maps, we hosted it on Mapbox.
-
Infrastructure management with devo.ps. Devo.ps, Wiredcraft’s server management solution, was the central piece to manage everything infrastructure: from continuous deployment to server configuration.
##Takeaway
Static applications are here to stay
With this app, we demonstrated one more time that static apps (both front-end and backend) can often superior alternatives to heavy dynamic applications.
The transition from a Drupal powered platform, which requires very specific knowledge and a lot of development resources, to a duo of lightweight applications which require little to no specific knowledge proved powerful:
- Secure and low maintenance. We were able to host the entire app, save for the data crunching worker, on GitHub Pages as a set of static files. There is nothing to hack and scaling the app is several orders of magnitude easier than with anything else.
- Low technical barriers to entry. The app is composed of straight Javascript libraries, HTML and SASS. The worker is built with regular Python. Anybody with access to Google could contribute to this app in under a hour.
- More time for experimentation, strategy and design. An indirect benefit of this approach is that it allows for quick, inexpensive experimentations and leaves more resources for strategy and design. We’re big proponents of the open source momvement.
We’re excited to see the World Bank experimenting with new technical approaches and look forward to seeing what people will build with these sub-national data sets.