Releasing the Southern Sudan Referendum results on Drupal
We already described how we built the data entry platforms for both the registration and results collections of the 2011 Southern Sudan Referendum. The next logical step to our collaboration with the IFES (International Foundation for Electoral Systems) and the Sudanese authorities was to develop a public website that would allow us to publish the results as collection would go through. The result of our work; SouthernSudan2011.com.
The data collection process was expected to take a few weeks; the vote took place from January 9 to January 15. From there votes needed to be aggregated in each of the 2,893 referendum centers, then sent to one of the two datacenters in Juba or Karthoum. These vote counts would then be processed through the data collection software we had developed, to ensure the integrity and accuracy of the results. Taking into account the various issues that may arise (transportation, for example, in some of these regions can be challenging), delays were expected and we decided to design a system that would allow the local staff to regularly update the system with the latest data they had in hands.
The overview: Feeds, Openlayers and Mapbox
This wasn”t the first time we were building a system revolving around an importer, neither were we new to geolocalization in Drupal; we had actually built a system pretty close to this one for a real estate platform. The main idea relies on using Feeds to regularly process CSV files which generate the results data, the rest is just configuration and a bit of “glue coding”.
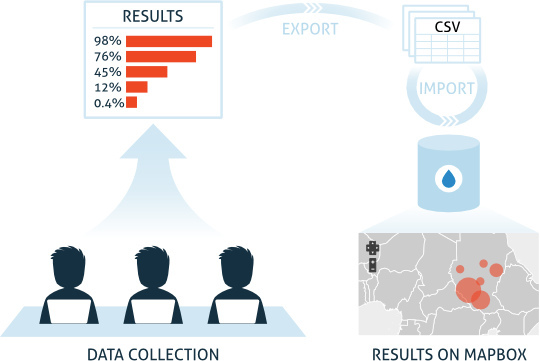
The results tabulation platform was from the very beginning designed to allow for exporting the collected data as raw CSV files; considering we had to interact with several organizations (IFES of course, but also the United Nations, NDI, and various other ones present on the ground), being able to quickly extract the up-to-date information in a format anybody could manipulate was crucial.
Taking these CSV files and manually pushing them to the server was a simple enough operation that could be performed by anybody on Wiredcraft or IFES” teams; Feeds would then operate its magic and create or update the several thousands results entries which would then be used to build the drill down of all the metrics at various levels (country, region, state and county).
Geolocating these entries wasn”t much harder, using the Geotaxonomy module (although collecting the actual coordinates of our locations proved to be a challenge of its own). Once this was done, we used Openlayers and Mapbox”s very own World Light tileset to visualize the distributions of votes on a map.
A few acknowledgments
I”d like to personally thank all the people who helped us through these projects, a few of them come on top of the list;
- Thomas Chanussot, IFES”s IT consultant in Sudan who helped with the adoption of an Open Source solution for that mission and provided an invaluable technical expertise.
- All of the IFES staff; Jerome Leyraud, Robert Irish, Antonio Spinelli, Ajay Patel, Phil Sforcina, Demetrio Lazagna, Kouadio Evrard, Parvinder Singh, Sara Staino, for their professionalism, insights on the situation in Sudan and for helping me and Makara feel at home in Juba.
- The Development Seed”s team, for proposing to add a lot more details to Sudan on their World Light tileset (thanks AJ) and helping me figuring out a few things with Openlayers Plus (thanks Tom).
Stay tuned
Follow our newsletter or our WeChat account; every other week you'll receive news about what we're up to, our events and our insights on digital products, omnichannel, cross-border ecommerce or whatever the team fancies.
-
Add us on WeChat

-
Subscribe to our newsletter