Data Visualization: Processing Images at 1250MB/s
Everyday you experience data visualizations and infographics, and you might not even be aware of it. As a species we have been using visual communication since we began finger painting on walls. Visual communication has evolved since our paleolithic ancestors, but we are still using it to communicate the data of our lives - only now we have a lot more data to represent.
Why do we use data visualizations and infographics?
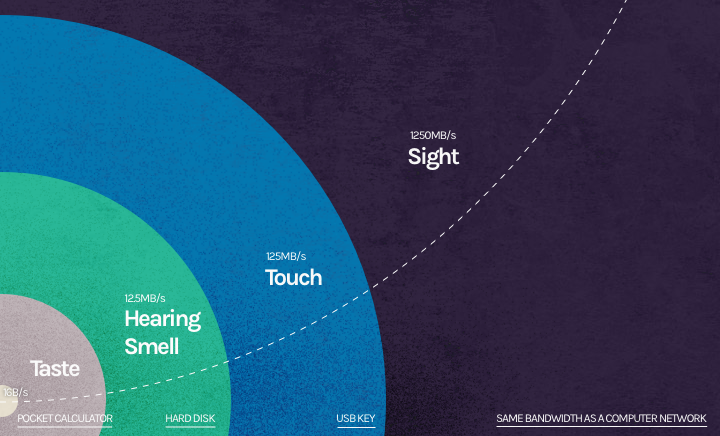 The "Bandwidth of Senses" - the small corner represents that we are only aware of 0.7% of the information we experience
Danish physicist Tor Nørretranders created the “Bandwidth of Senses” infographic presenting his research on the speed of senses relative to computer terms. He concluded that the sense of sight is comparable to 1250 MB/s, or the same bandwidth as a computer network.
If you compare sight with the next strongest sense touch, the processing speed of sight is 10 times faster. Factoring in the mind’s ability to process visual information 60,000 times faster and with greater understanding than text, you get a mind and eye network that’s primed and ready for data visualization and infographics.
How is big fat data changing data visualizations?
According to IBM, in 2012 our daily output of data is 2.5 quintillion bytes of data - and that was three years ago. I’ll let that sink in for a second since most of us might need to look up what a quintillion byte is (2.5 exabytes or 2.5 billion gigabytes or 2.5 followed by 18 zeros). If that wasn’t mind blowing enough, between 2010 and 2012 we created 90% of all available data at that time.
So what to do with all this data? This is where our ability to process images at high “bandwidths” comes in to hand. By leveraging data visualizations and infographics, we can take the raw data and make it useable. You don’t have to struggle through a wall of text, spend hours scanning spreadsheets, or need a specific set of skills to decrypt it, you can just use your eyes and our innate ability to draw patterns to understand the data.
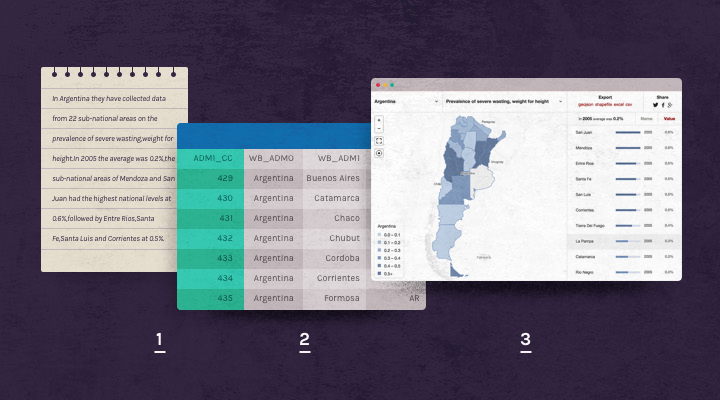
You can see for yourself. Although you can extract the same information from all three formats, the visualized one is the easiest and fastest to process.
International Development <3 Data Visualization
The international development community uses open data and data visualizations to help influence public opinion and policy-makers on social development issues including climate change, poverty and inequality. The community has discovered that data visualizations provide some specific advantages for processing their Open Data.
- You can draw conclusions from data visualizations in a glance. You will find yourself identifying patterns and trends, and singling out extraneous information such as outliers or exceptions.
- Data visualizations transform how you interact and engage with data. You can manipulate and customize indicators and variables to explore the data to suit your own needs and curiosities. As you interact more with data, it becomes easier to understand, access and present (such as what we did with the Aqueduct project for WRI).
- Data visualizations are viral. They become contagious on Twitter, Facebook and Pinterest, reaching billions of users each year.
- Technology is getting through to policy-makers and the public. Data visualizations, finally, allow government data to be more accessible and feed the political process.
As data visualizations continue to be the heartbeat of the intersection of data and technology, the way we approach, solve and visualize social problems is changing for the better.
Stay tuned
Follow our newsletter or our WeChat account; every other week you'll receive news about what we're up to, our events and our insights on digital products, omnichannel, cross-border ecommerce or whatever the team fancies.
-
Add us on WeChat

-
Subscribe to our newsletter