Design is like an Iceberg. Inside Information Architecture.
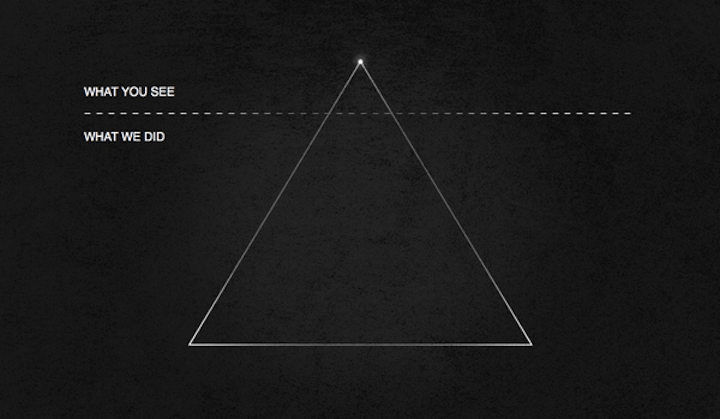
Design is like an iceberg. Over 90% is below the surface, and you can only see a small portion of what is created. We are gonna take you under the surface, and examine our project for the regional statistical information of voters.
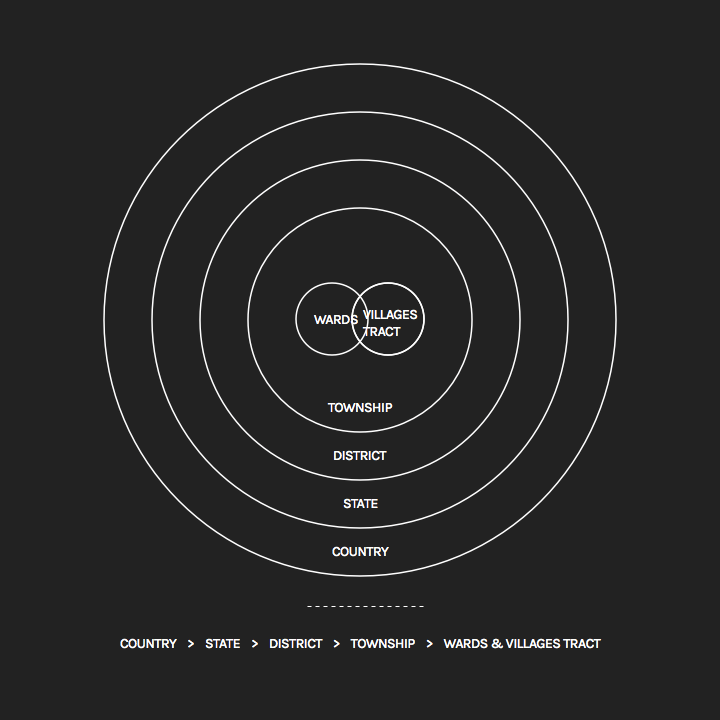
We were tasked with providing five reports that provided various demographic information from regional all the way to wards and village level. The above graphic represents the data that we need to have represented. As you can see from the graphic below wards and village tracts make up Townships, which make up districts and then states at the largest regional level.
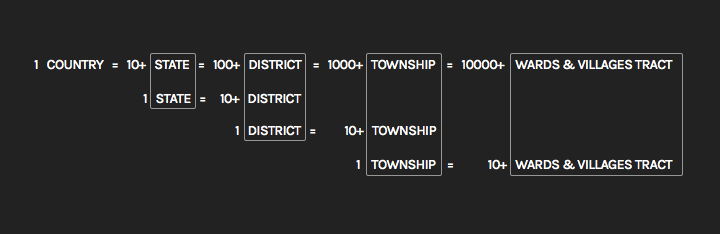
Since the data would be collected in real time we were unable to process the information with real data, so we turned to Wikipedia to get approximations. We started working with subsets of 10 and began creating the infrastructure for the report.
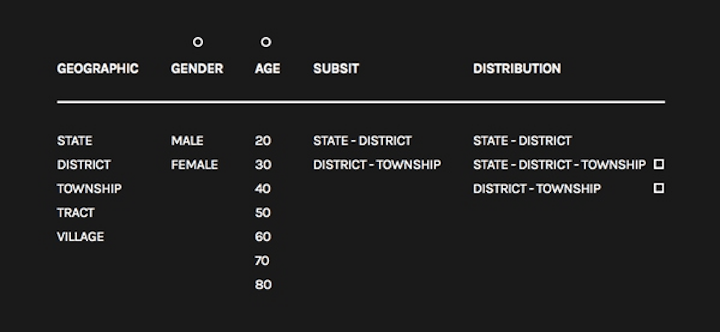
Although none of this original planning and implementation gets released to the client, the organization and layout is vital to the finished product. You can see the content classification list transformed in to the final product.
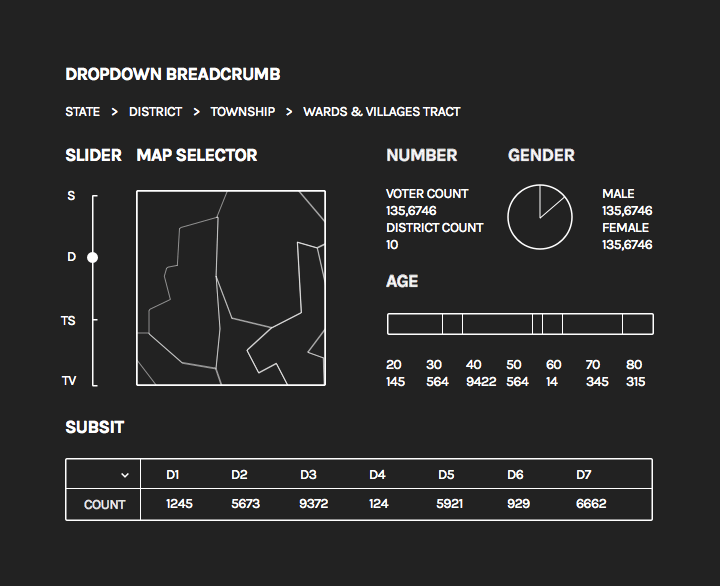
We organized the content using a dashboard format. The information can be pulled down to make breadcrumbs navigation. The five reports are now listed in a simple and clear way through data visualization: gender indicated in the pie charts and age in a bar chart. The subset voter distribution is presented in the chart and the geographic information is in the map selector.
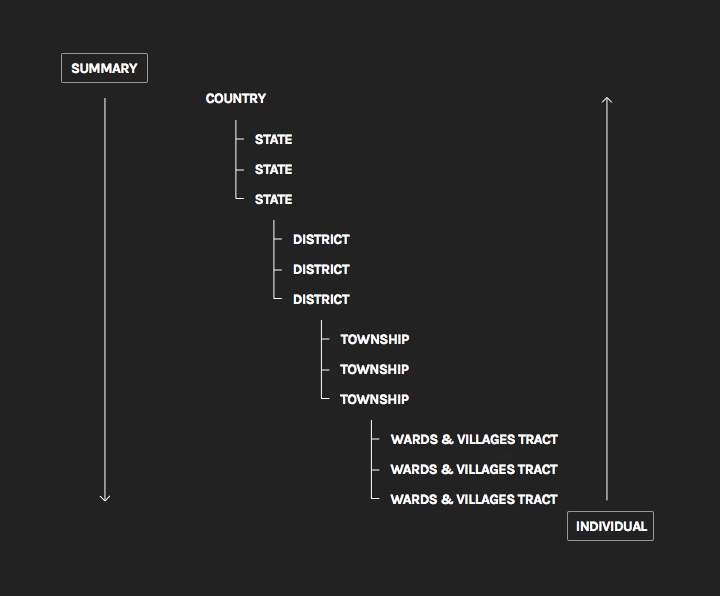
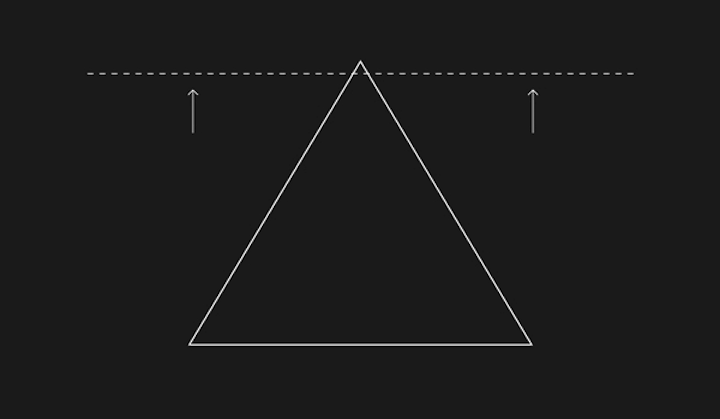
A diagram showing both the top and bottom orientation of the data. The relationship between the number (shown above) could have more than 10,000 data points for the “Wards & Villages Tract” metric.
The advantages to a bottom-up layout.
- Layout highlights individual areas of data in a dashboard.
- Data can be displayed on less than a page.
- Increased data legibility with support of data visualizations in charts and maps.
The disadvantages to the bottom-up layout.
- A lot of interactions mean that it could be difficult for the data to be printed.
- Difficult to implement.
The advantages of a top-down layout.
- Highlights the data hierarchy.
- Easy to find, switch, and edit.
- Simplified five reports into one.
The disadvantages of a top-down layout.
- Not a dynamic visual look. No support for complex data visualizations.
We created a wireframe of both top-down and bottom-up layouts so that we could communicate directly with our clients regarding the design.
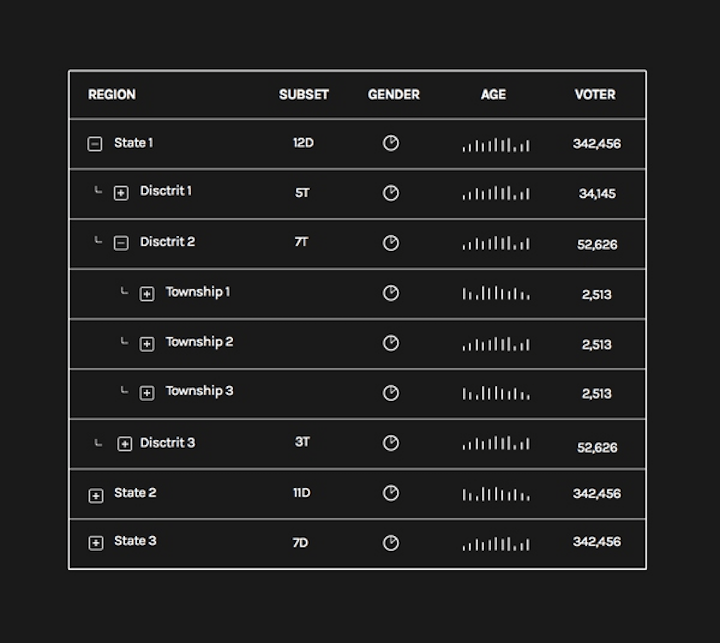
Our client preferred the design to display data with flat design and directly so that the data could be printed. So we created a top-down tree summary table.
The look we created was simple but it provided all the features for our client in a printable format.
We like to take Dieter Rams design concept and make it our own.
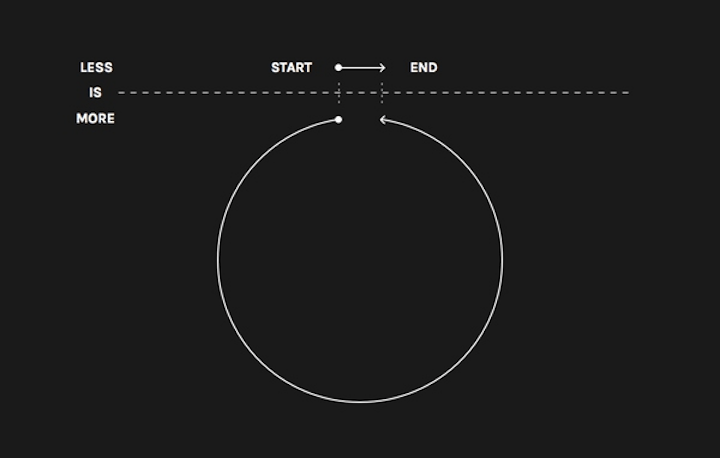
Less is more…
But the “less” is actually the information you want to show, and the “more” is to make the display of information more efficient.
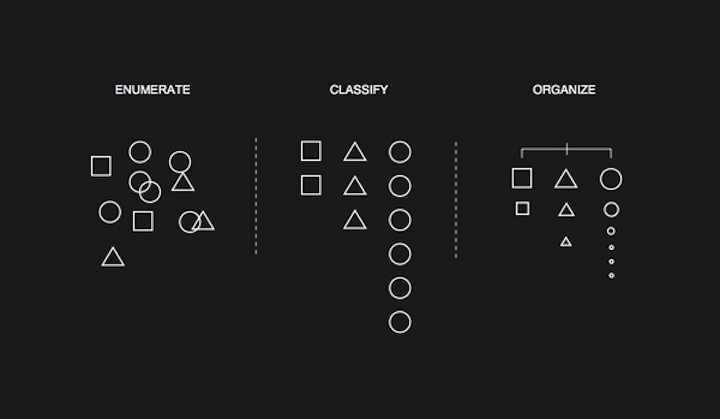
The most useful implementation when processing information architecture design methods is enumerate information, classify information, and organize information.
Although you don’t see all the work that goes in to the final design, having a solid information architecture foundation is important. So we spend a lot of time and effort to make sure it is correct. Having a strong and organized foundation in your recessive design will help provide better final products, that are easier to change and to implement. The current trend is to create quick and fast designs but we believe that they are “bubble” designs and will burst with any change, leaving us confident in the decision to invest in information architecture.
Stay tuned
Follow our newsletter or our WeChat account; every other week you'll receive news about what we're up to, our events and our insights on digital products, omnichannel, cross-border ecommerce or whatever the team fancies.
-
Add us on WeChat

-
Subscribe to our newsletter